Attendance
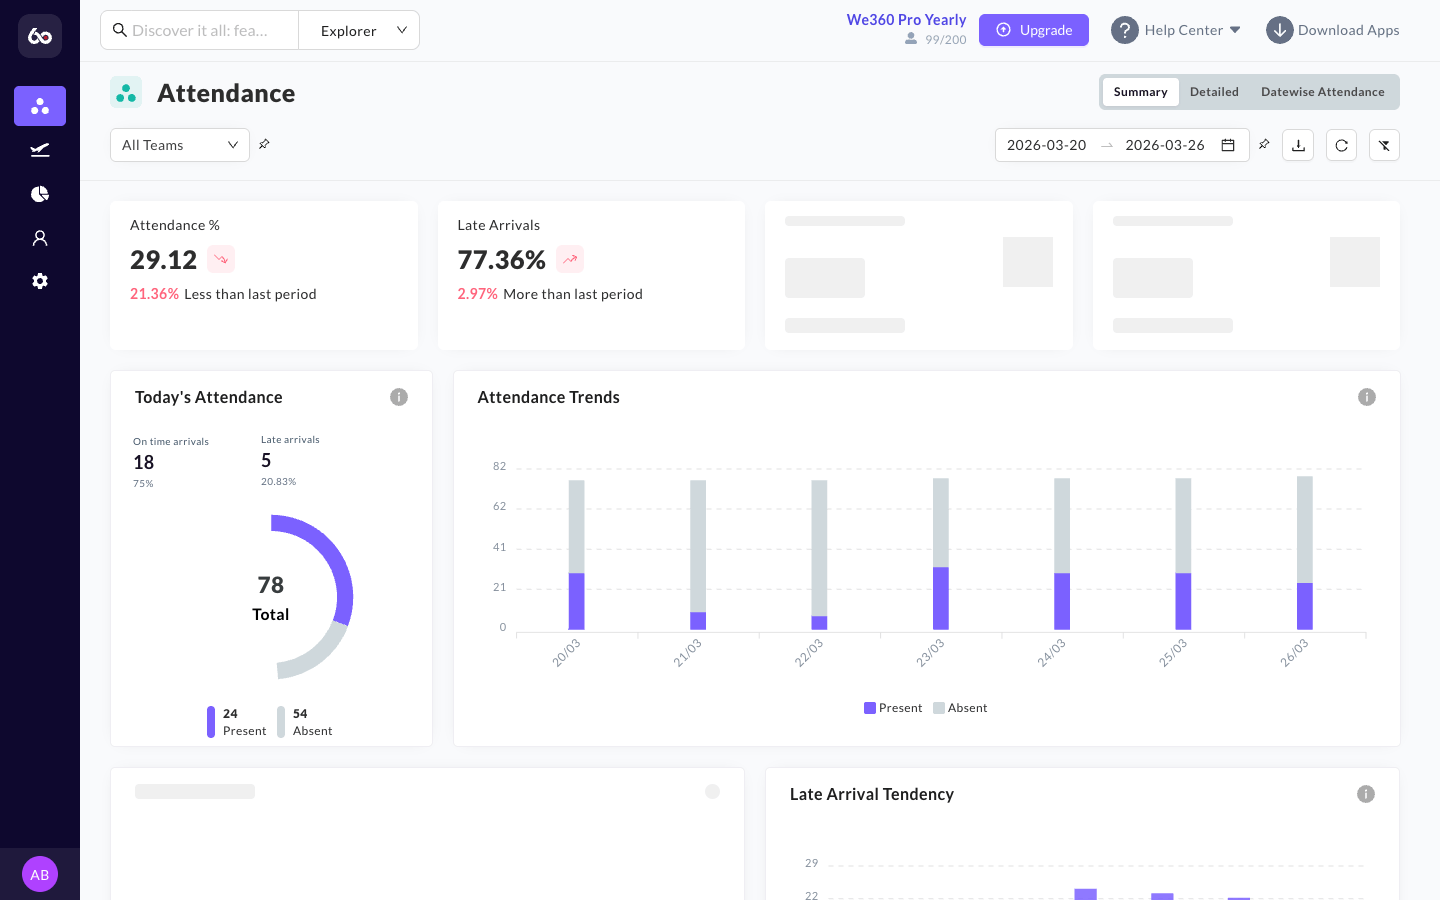
We360.ai attendance dashboard — track employee entry, exit, breaks, lateness, and daily attendance metrics.
The Attendance dashboard provides HR teams and Managers with a bird's-eye view of employee presence, punctuality, and daily habits. It functions as the definitive ledger of when an employee is actively "at work."

Reporting Views
The Attendance section is divided into three distinct reporting tabs, allowing managers to zoom in from high-level trends down to minute-by-minute logs.
Summary Tab
Provides macro-level metrics for the entire organization or selected teams over a date range. With the Teams and Date Range filters, admins have the flexibility to access insights for any team on any date range. By default, the team filter is set to the entire organization and the date range is set to "Last 7 Days."
Metric Cards: Four summary cards are displayed at the top:
Attendance %: The overall attendance percentage, with a comparison showing the movement relative to the previous period (e.g., "25% more than the previous 7 days").
Late Arrivals %: The percentage of employees arriving late, with period-over-period comparison.
Total Break Time: Aggregate break time for the selected filters, with comparison to the prior period.
Total Working Time: Aggregate working hours, with comparison to the prior period.

Widgets and Graphs:
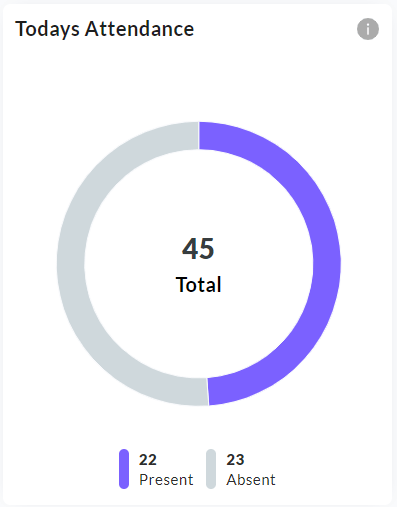
Today's Attendance: This widget always displays today's attendance count and is not affected by the date range filter. Team filters still apply.

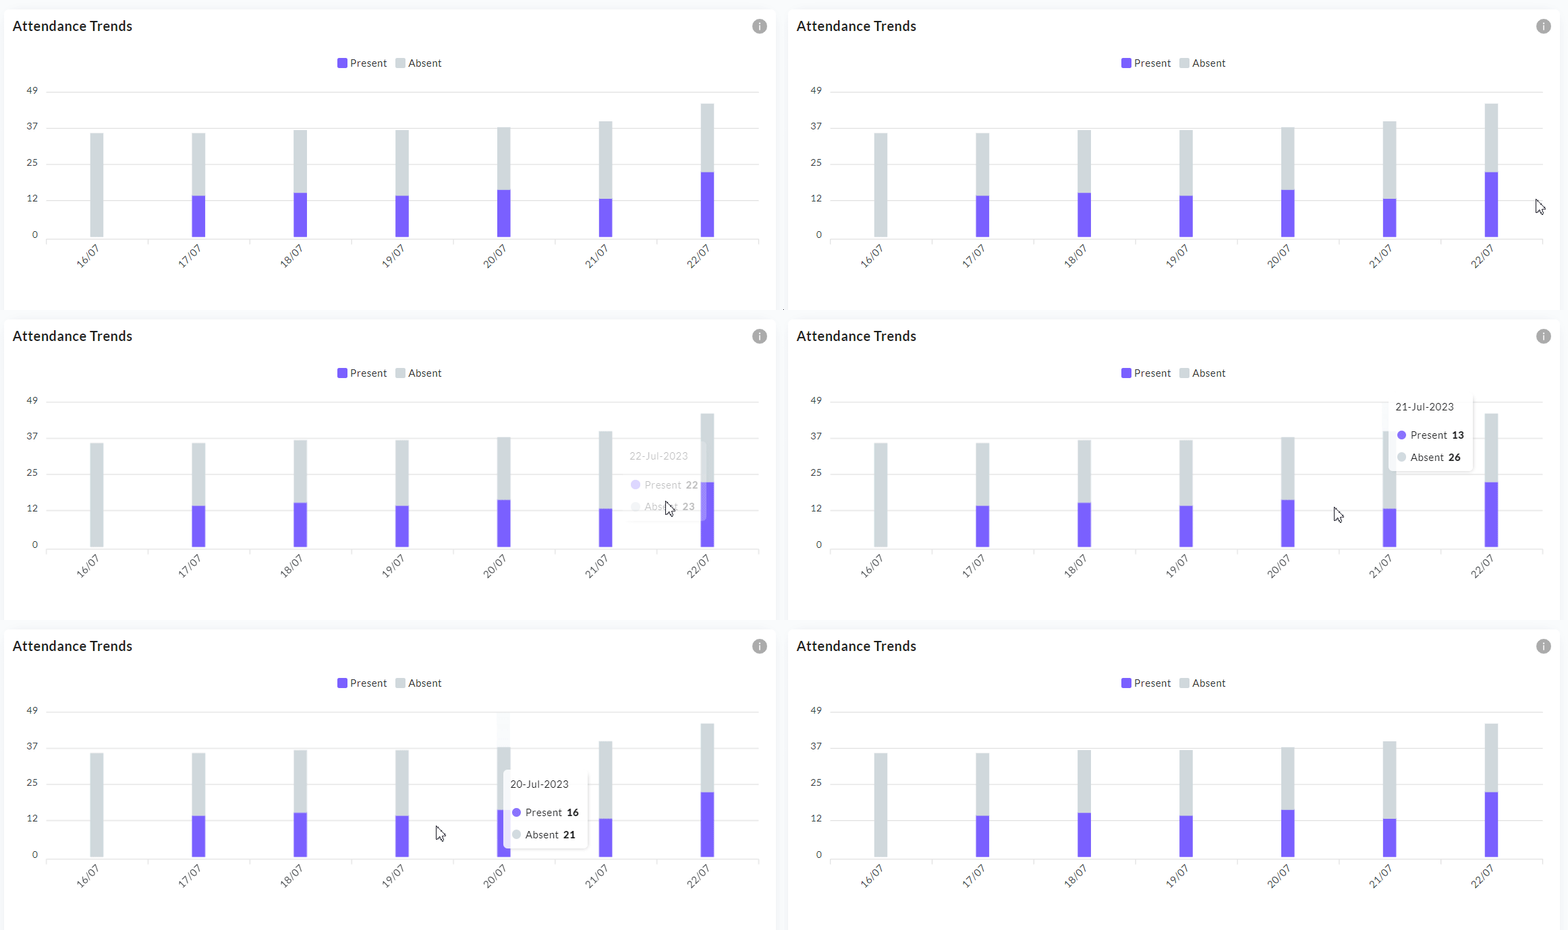
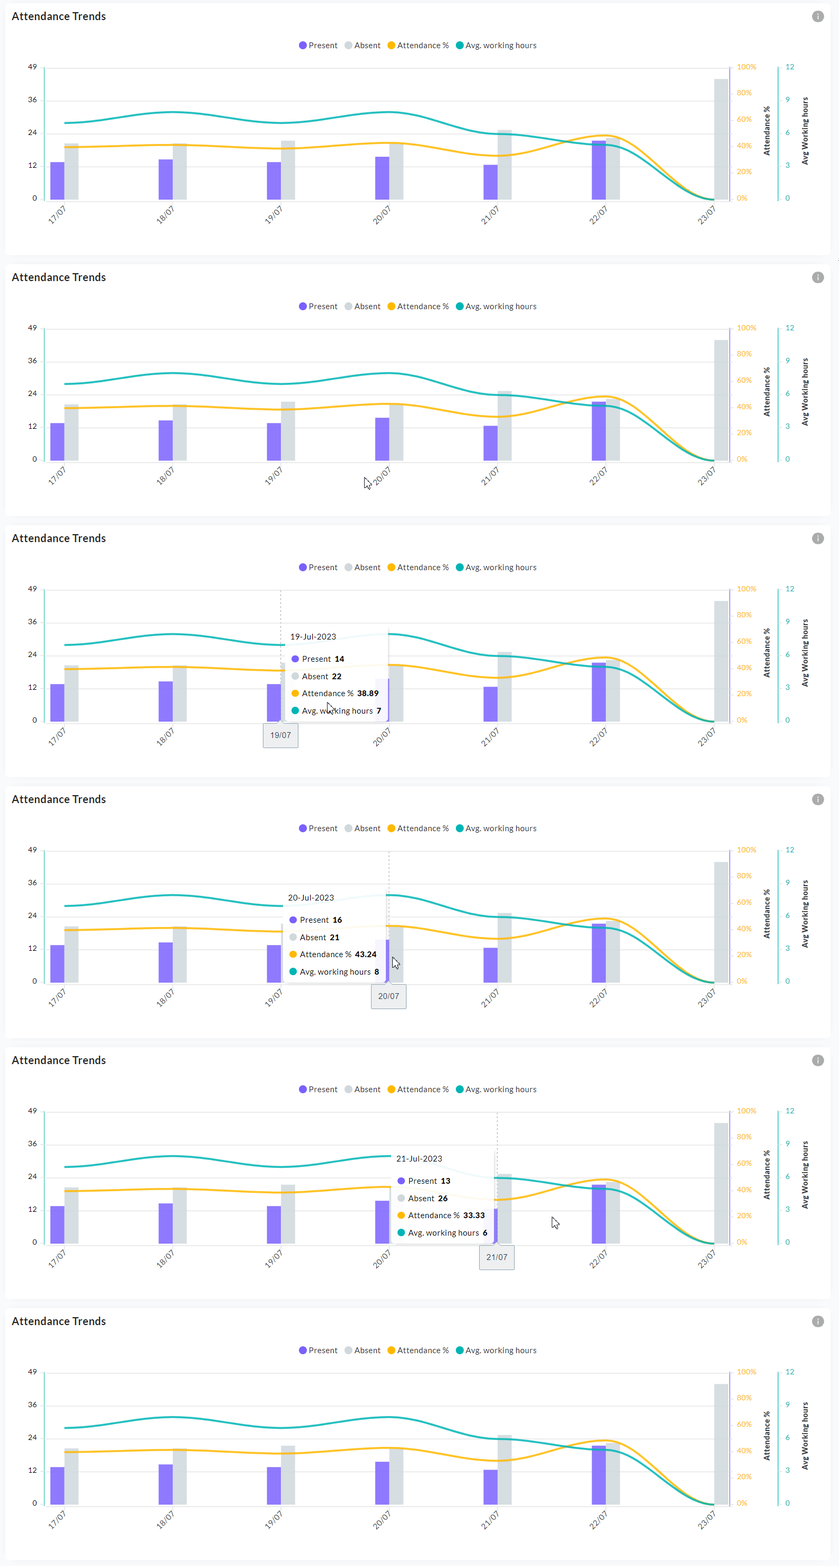
Attendance Trends: A bar graph showing the trend of present and absent employee counts over the filtered date range.

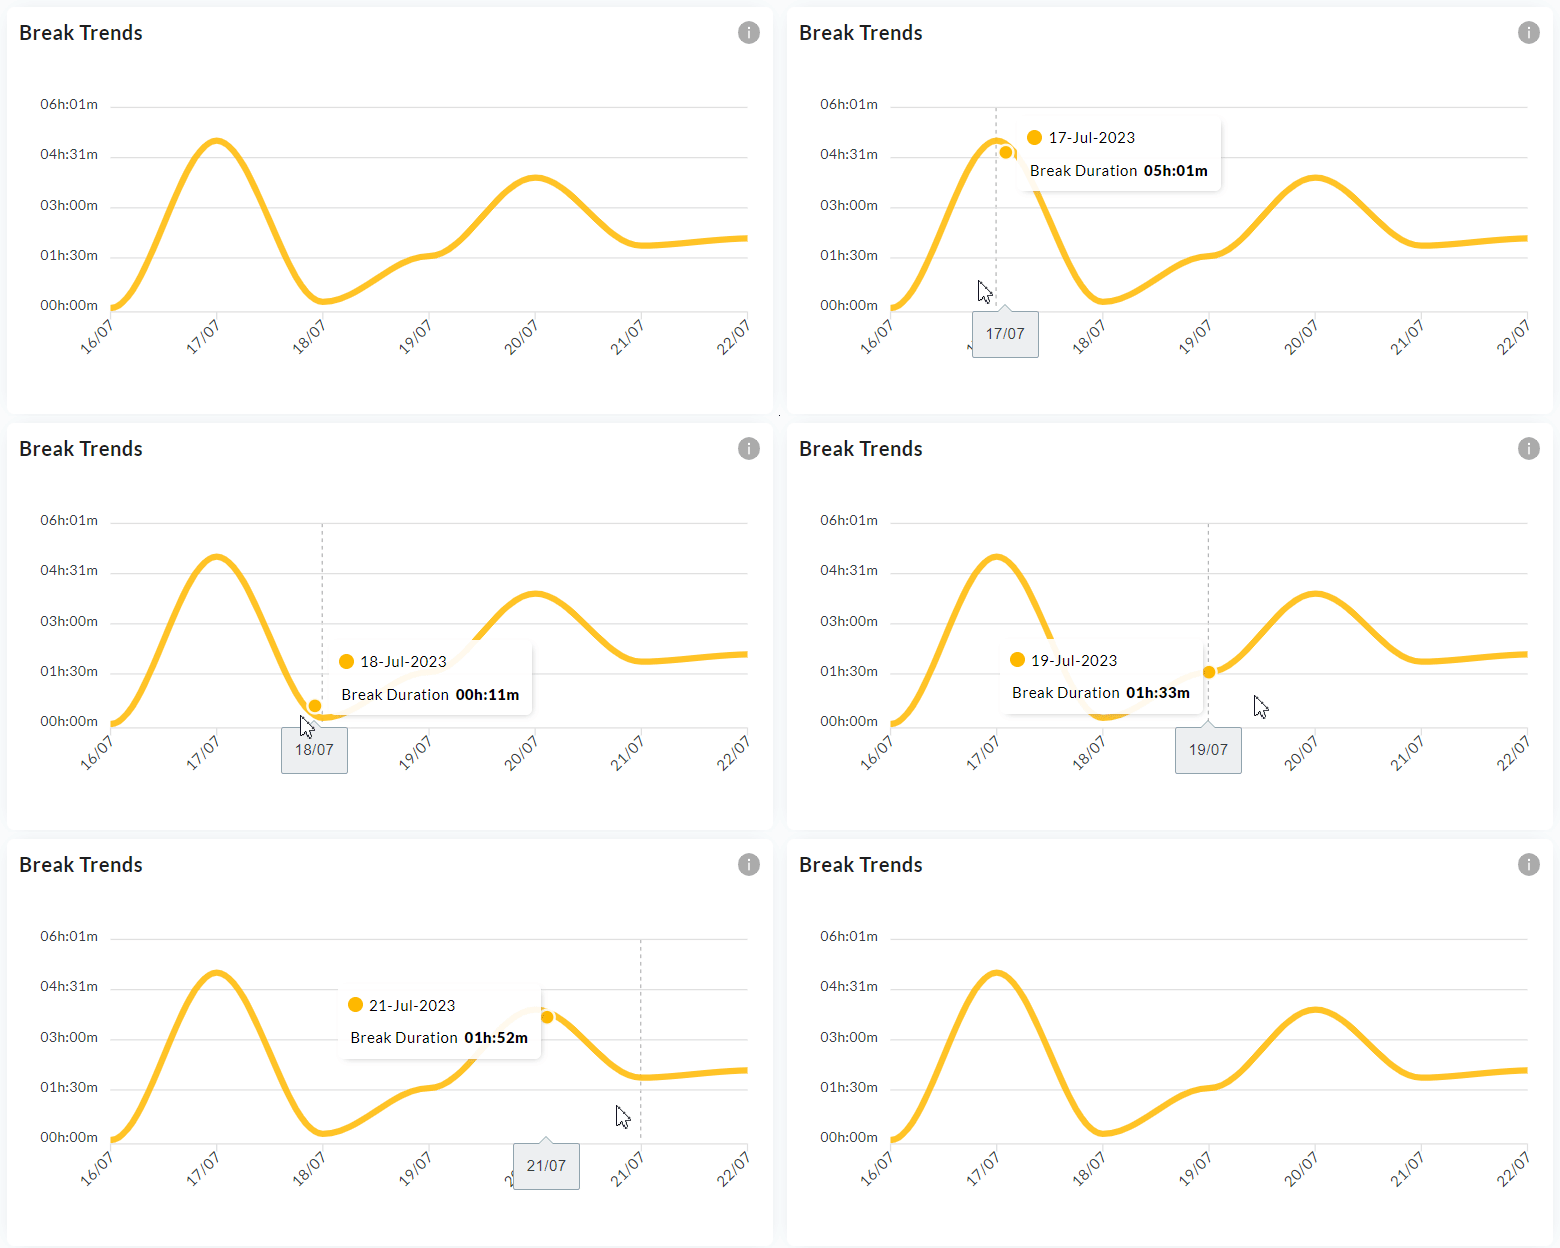
Break Trends: A line graph displaying the trend of total break time taken by the filtered team over the filtered date range.

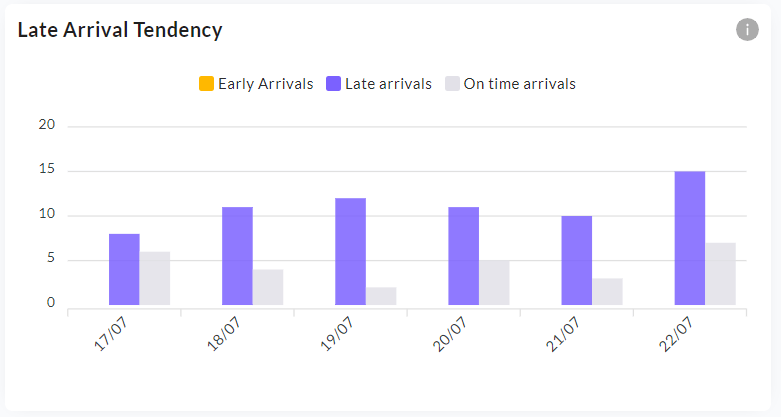
Late Arrival Tendency: A grouped bar graph showing the number of late arrivals versus on-time arrivals within the applied filters.

Export PDF: The Summary tab includes a PDF export option, generating a formatted cover sheet and executive summary of the attendance health for the period.
How key metrics are calculated
Attendance % -- For a single date:
Present Employees / Total Employees. For a date range: the same ratio averaged across all days in the range.Late Arrivals -- The percentage of present employees who punched in after the start of their shift and outside the configured grace period. For example, if the grace period is 10 minutes, anyone punching in 10+ minutes late is counted. Over a date range this percentage is averaged.
Working Time -- The sum of all successive (punch-out minus punch-in) durations for each employee across the selected period.
Break Time -- Total time employees spend in an active "Break" status (triggered manually or automatically based on configured break policies).
Detailed Tab
Allows managers to drill down into specific employee performance. Includes team, user, and date range filters.
Trend Graph: Displays attendance trends for the selected filters.

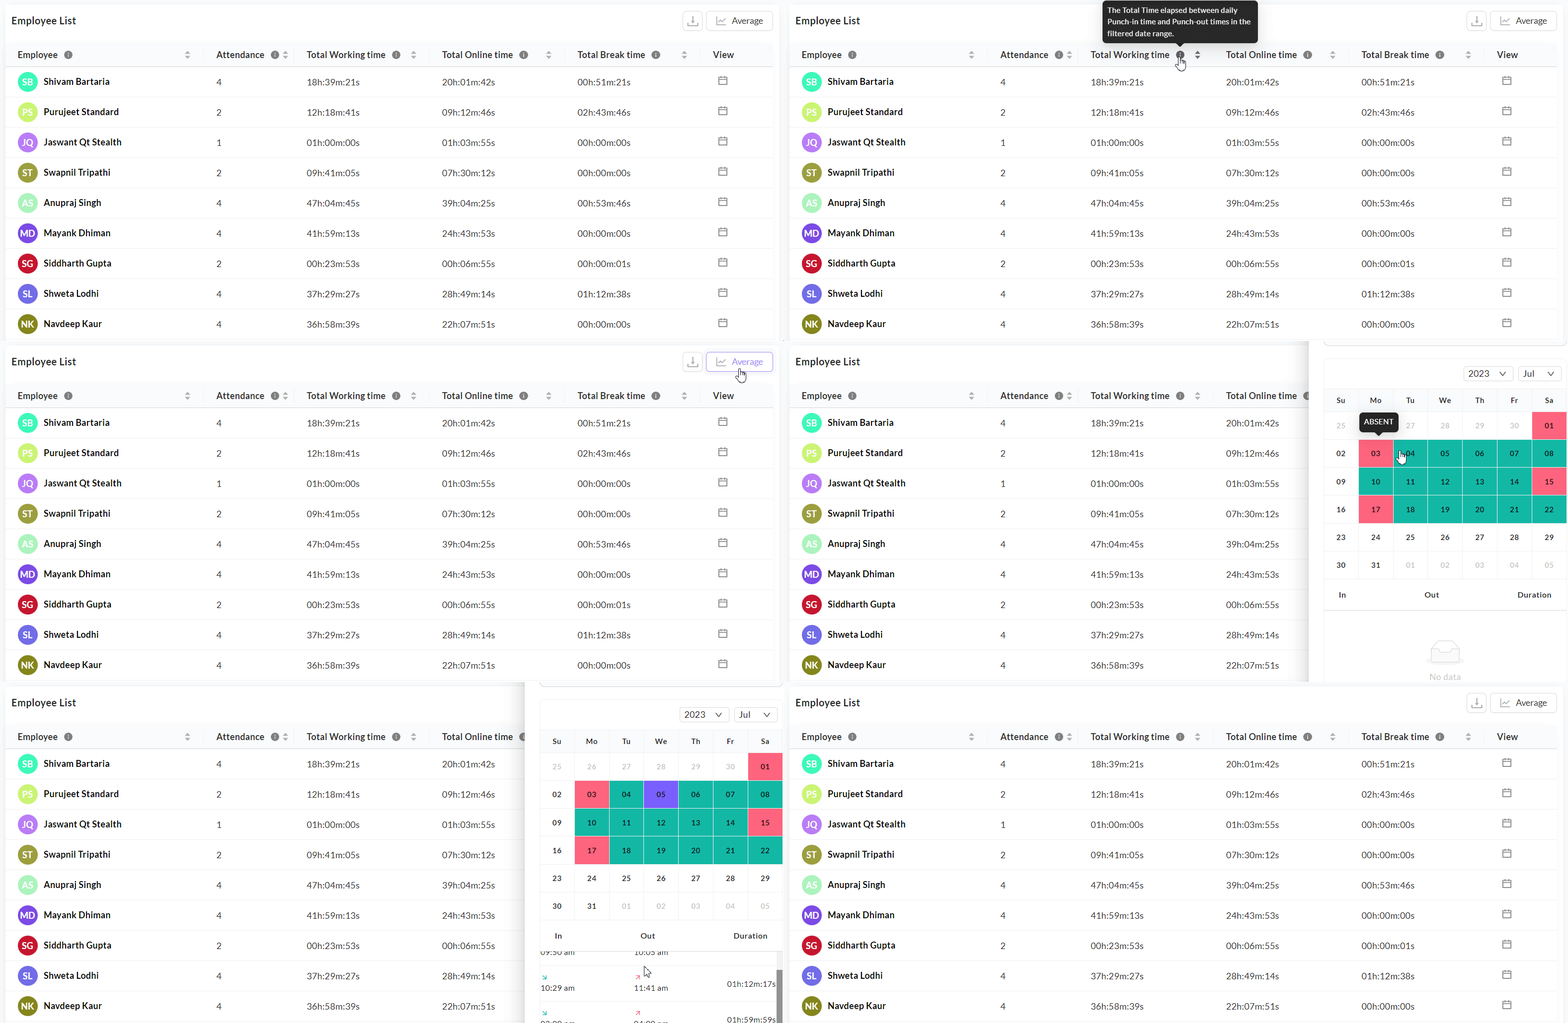
Data Table: Displays a paginated list of employees with their attendance, working time, online time, and break time for the selected date range.

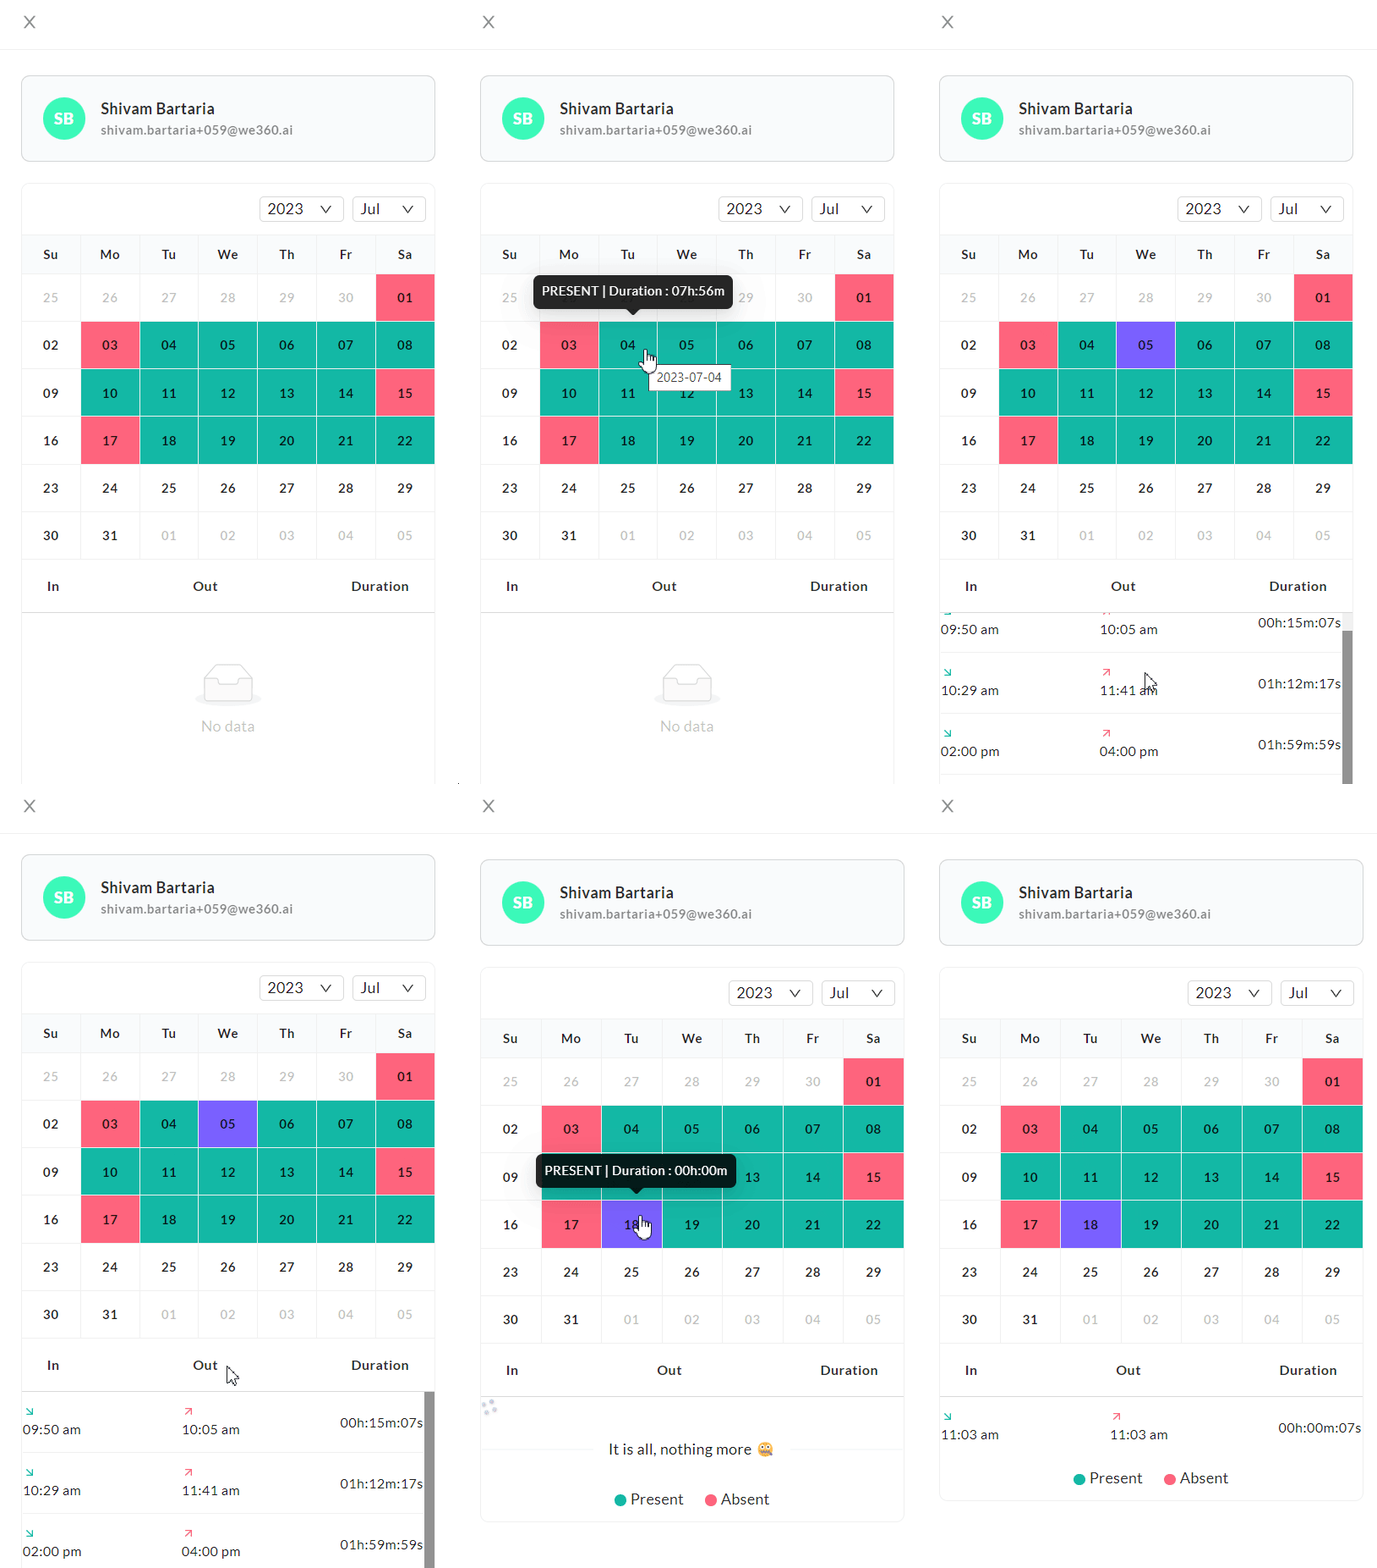
View Calendar: Each employee row includes a "View Calendar" button. Clicking it opens a modal popup showing the present/absent status for each day of the month. Clicking on any day when the employee was present reveals the detailed presence logs, including in/out timestamps and working time duration.

Export CSV: This view enables exporting a granular CSV file for payroll processing.
Datewise Attendance Tab
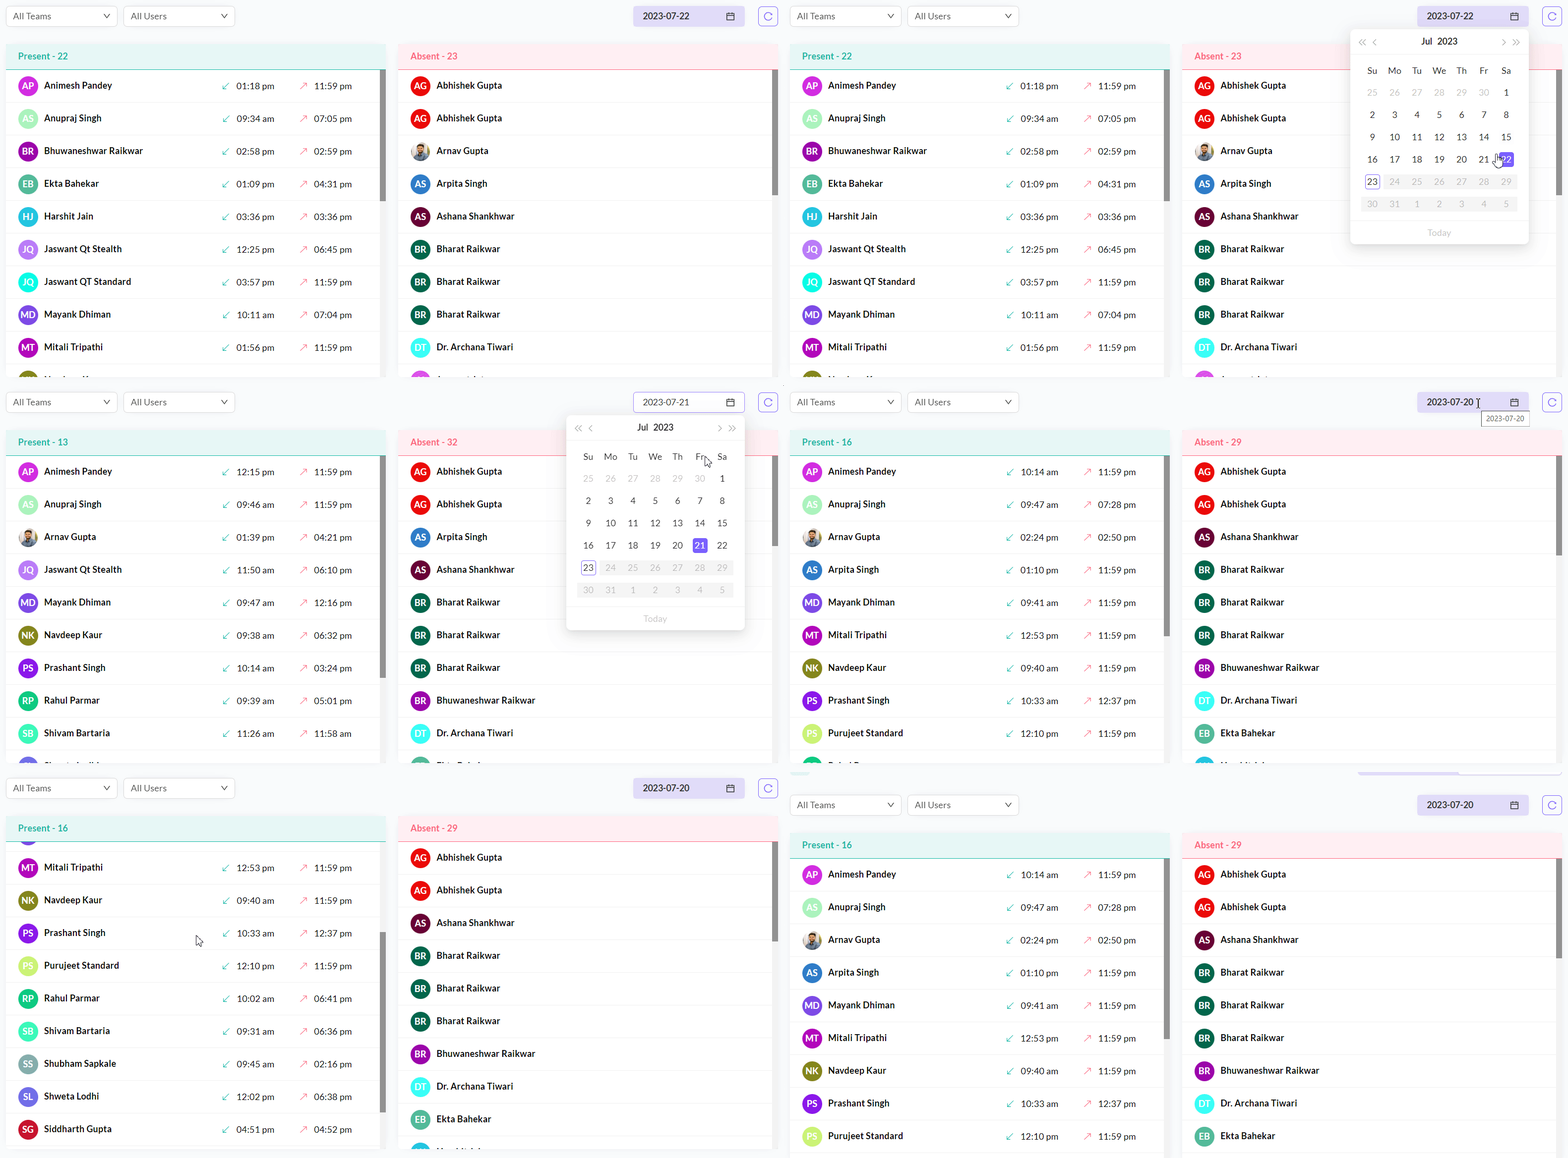
A single-date view where admins and managers can see the present/absent statistics for a particular day. Present employees are arranged in a list on the left and absent employees on the right. For each present employee, the in/out timings are displayed.

The in/out timings shown are the first punch-in and last punch-out times for the day. If an employee has punched in/out multiple times during the day, only the earliest in-time and latest out-time are displayed. For employees who have not yet checked out, only the in-time is shown.
Last updated
Was this helpful?