# Supplemental Tracking

Beyond standard time and application monitoring, the Productivity Suite offers supplemental tools to manage edge cases and hardware context.

## Apps & URLs

A straightforward, exhaustive list of every single application binary and website domain accessed by the team over a given period.

<details>

<summary>Features</summary>

* **Summary and Detailed Tabs**: The Apps & URLs section is organized into two tabs:
  * **Summary Tab**: Provides metric cards showing the top applications used, top URLs accessed, and the top categories for the selected team(s) and date range. It displays a **category utilization chart** showing the complete distribution of time spent across each category (productive, unproductive, or neutral), plus ranked lists of application usage and URL usage in decreasing order. The summary view can be downloaded as a PDF.
  * **Detailed Tab**: Includes team, user, and date range filters. The view is divided into two panels:
    * **Left Panel**: Lists all categories with the total hours of utilization and the number of active users for each category during working hours.
    * **Right Panel**: Clicking any category on the left reveals deeper insights on the right, including an **Application-wise Utilization** chart (with a switcher to view URL usage for the same category) and a **Teamwise Utilization** chart showing how different teams spend time in the selected category. Clicking on any individual application opens three detail tabs: **Logs** (showing project or file activity logs and durations), **Users** (listing all employees and teams that used the application), and **Usage** (a usage graph showing whether the app is classified as productive, unproductive, or neutral across different teams).
* **Shadow IT Discovery**: Quickly identify unauthorized app usage or risky websites.
* **Cumulative Time**: View the total cumulative time spent on a specific domain across the entire organization, helping to justify or cancel software subscriptions.
<figure><img src="/files/AU54CzUIhTjoqNHDkdlB" alt="Apps and URLs listing"><figcaption><p>Apps &#x26; URLs view showing application and website usage across the organization.</p></figcaption></figure>

</details>

## Wellness (Wellness360)

**Wellness360** analyzes work habits to identify signs of employee fatigue and burnout, ensuring tracking isn't only used for performance, but for employee health.

<details>

<summary>Features</summary>

* **Wellness Categories**: Employees are classified into three wellness states:
  * **Healthy**: Working within expected hours and maintaining a balanced workload.
  * **Overburdened**: Working significantly more than expected hours, indicating potential burnout risk.
  * **Underutilized**: Working significantly less than expected hours, which may indicate disengagement or capacity issues.
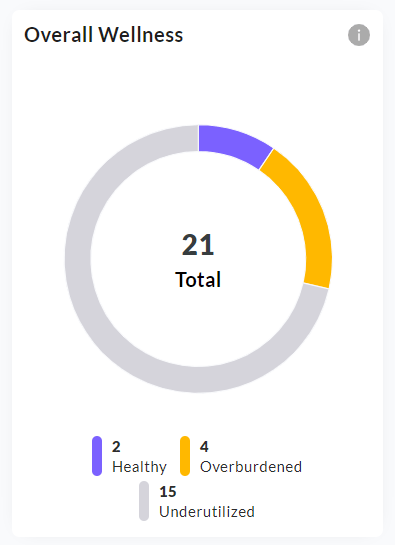
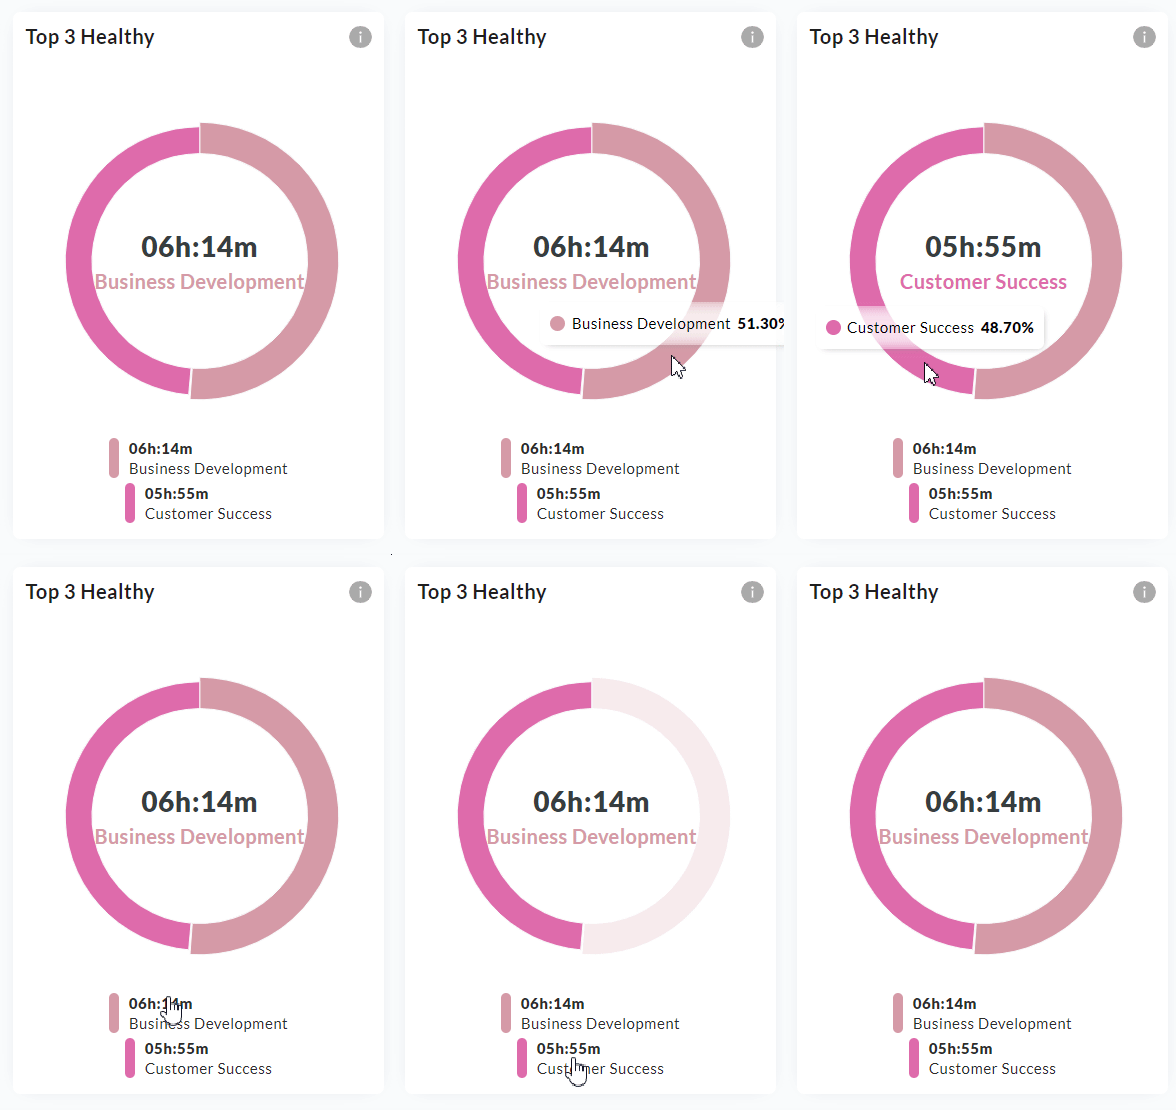
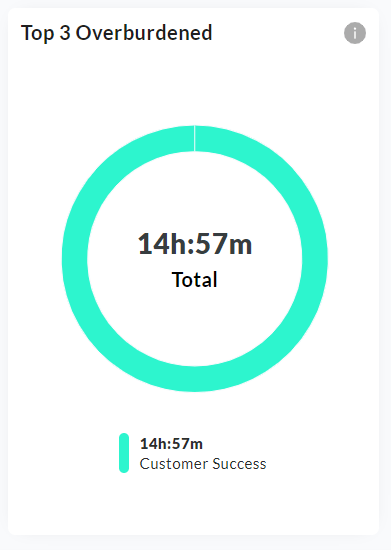
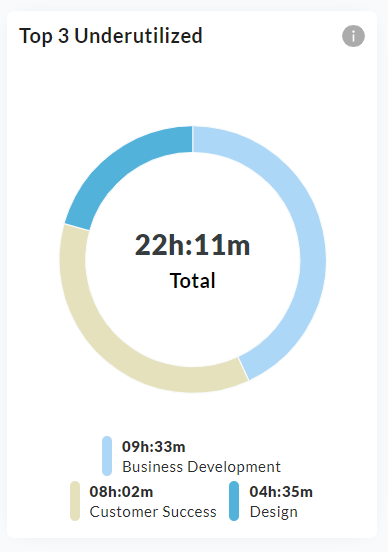
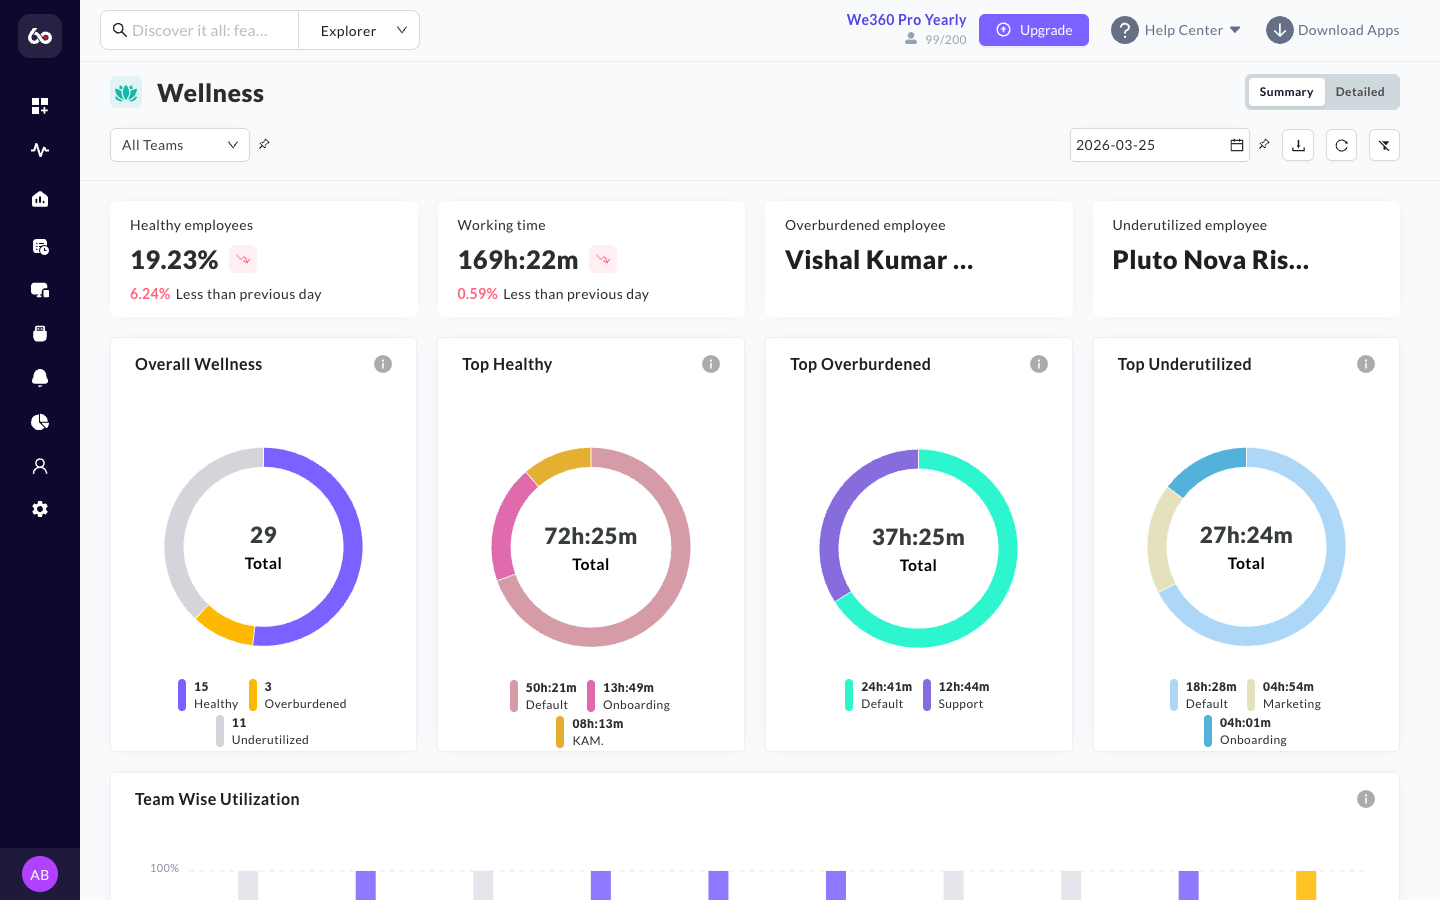
* **Summary View**: Displays metric cards showing: the percentage of employees who are Healthy, total Working Time for the selected date (with a comparison to the previous day), the most overburdened employee, and the most underutilized employee. Below the cards, four pie charts provide visual breakdowns: **Overall Wellness** (distribution of Healthy, Overburdened, and Underutilized employees), **Top Healthy** teams with their working hours, **Top Overburdened** teams with their working hours, and **Top Underutilized** teams with their working hours. The summary view uses a single date filter and teams filter, and can be downloaded as a PDF.

<figure><img src="/files/Zk1rj9H583yZrllw7m0j" alt="Wellness metric cards"><figcaption><p>Wellness summary metric cards: Healthy %, Working Time, Most Overburdened, and Most Underutilized.</p></figcaption></figure>

<figure><img src="/files/kXIcIqAuRxg9lUCCiztc" alt="Overall Wellness donut"><figcaption><p>Overall Wellness donut chart showing Healthy, Overburdened, and Underutilized distribution.</p></figcaption></figure>

<figure><img src="/files/R383oKIY0aL621LIgiIq" alt="Top Healthy teams"><figcaption><p>Top Healthy teams with their working hours breakdown.</p></figcaption></figure>

<figure><img src="/files/1S1o7eEh8gL9H0n229zk" alt="Top Overburdened teams"><figcaption><p>Top Overburdened employees flagged for potential burnout risk.</p></figcaption></figure>

<figure><img src="/files/rBlZcM1R4Px3IROD81Ho" alt="Top Underutilized teams"><figcaption><p>Top Underutilized employees who may need workload rebalancing.</p></figcaption></figure>

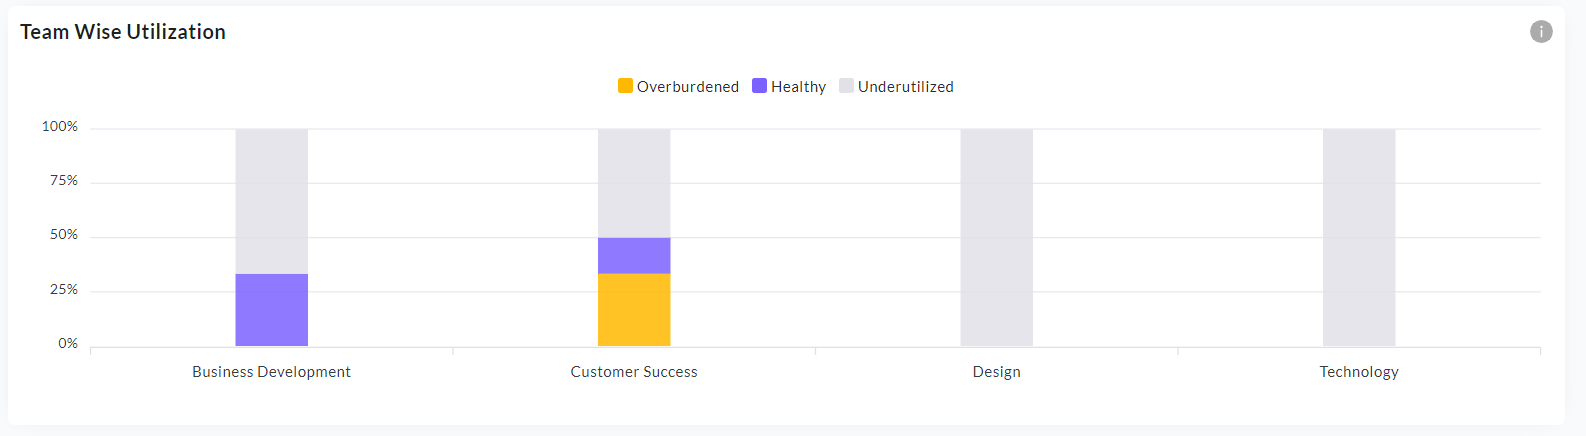
* **Team Wise Utilization**: A chart showing the distribution of Healthy, Overburdened, and Underutilized employees **per team**, enabling managers to identify teams with systemic workload imbalances and compare all teams at once.

<figure><img src="/files/4g8viHUspV4FRmUfSFFZ" alt="Team Wise Utilization chart"><figcaption><p>Team Wise Utilization comparing wellness distribution across all teams.</p></figcaption></figure>

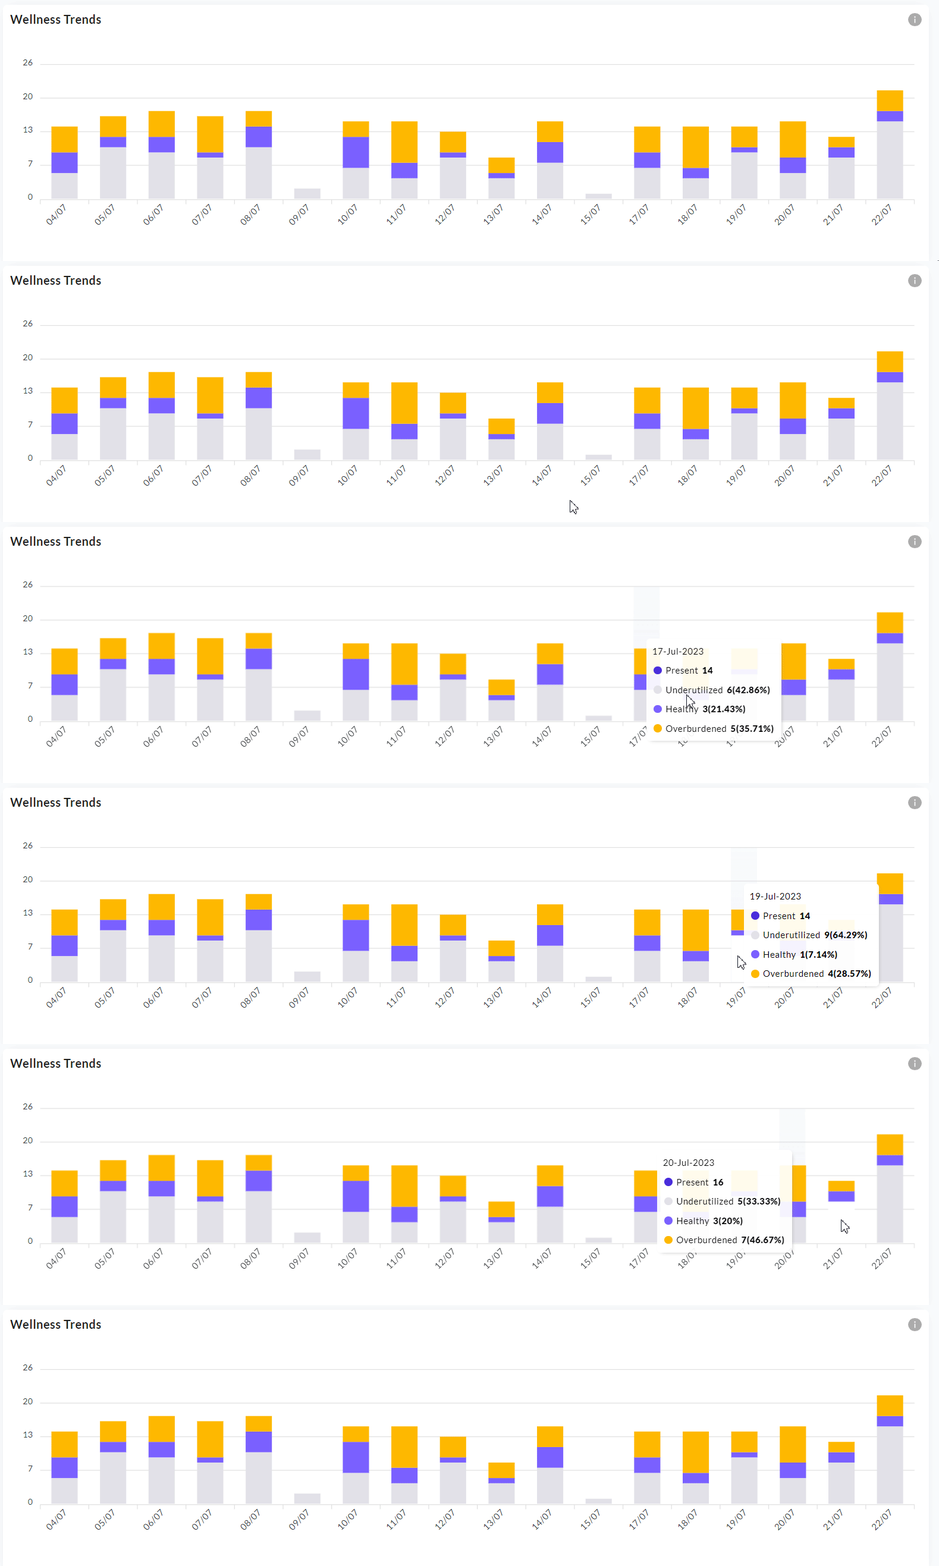
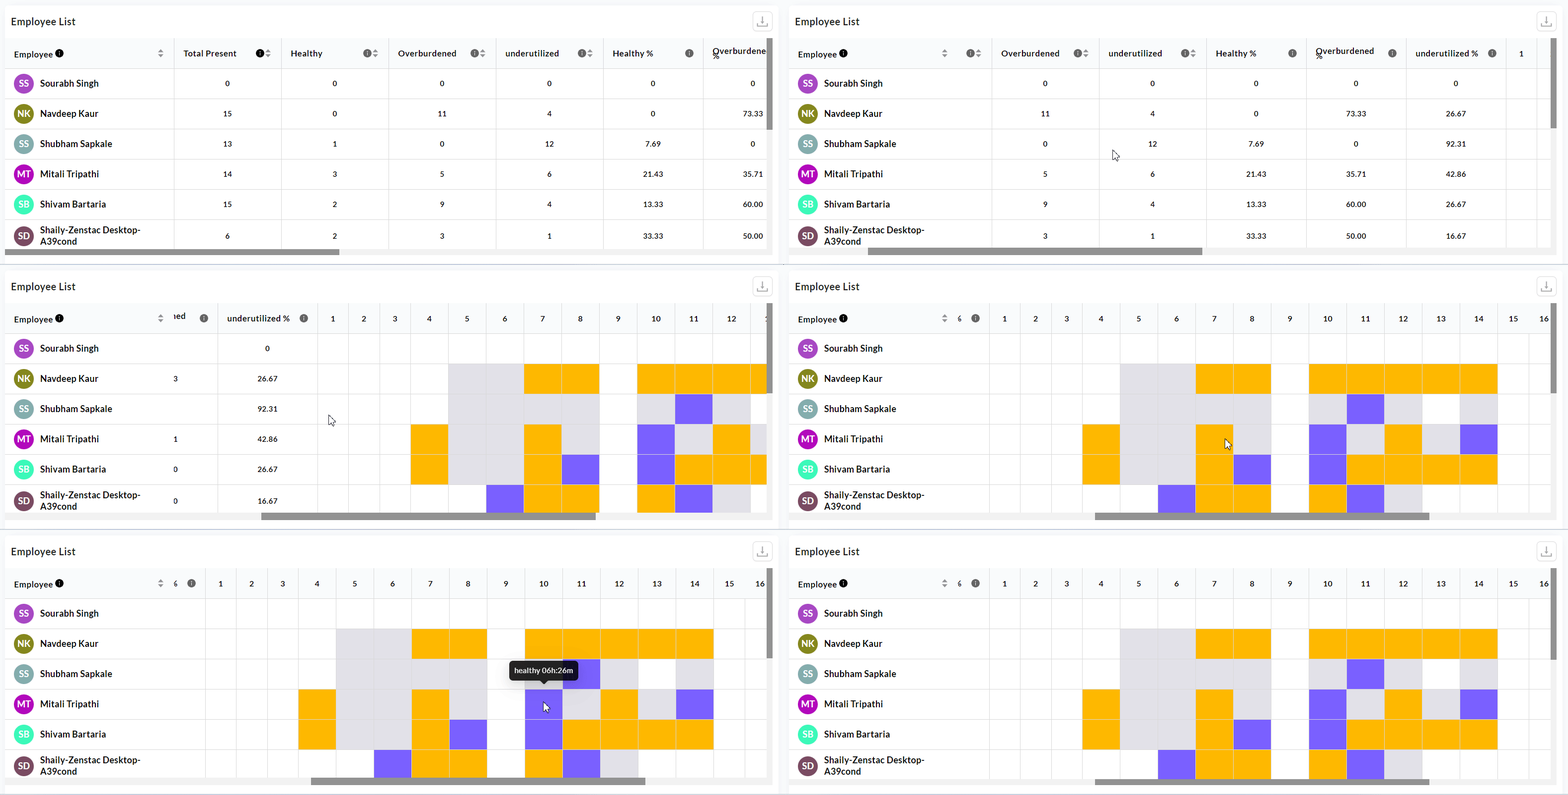
* **Detailed View**: The detailed view provides team, user, and month filters. It includes a **Wellness Trends** graph displaying the distribution of employees who are Healthy, Overburdened, and Underutilized over time. The detailed employee table lists each employee with the following columns: **Total Present Days**, **Healthy days**, **Overburdened days**, **Underutilized days**, **Health %**, **Overburdened %**, and **Underutilized %**.

<figure><img src="/files/Af69cwawndI0b9gVTzhZ" alt="Wellness Trends graph"><figcaption><p>Wellness Trends showing the distribution of wellness states over time.</p></figcaption></figure>

<figure><img src="/files/nmmKMaZAVGKsFOz68xid" alt="Wellness detailed table"><figcaption><p>Detailed employee table with wellness metrics per employee.</p></figcaption></figure>

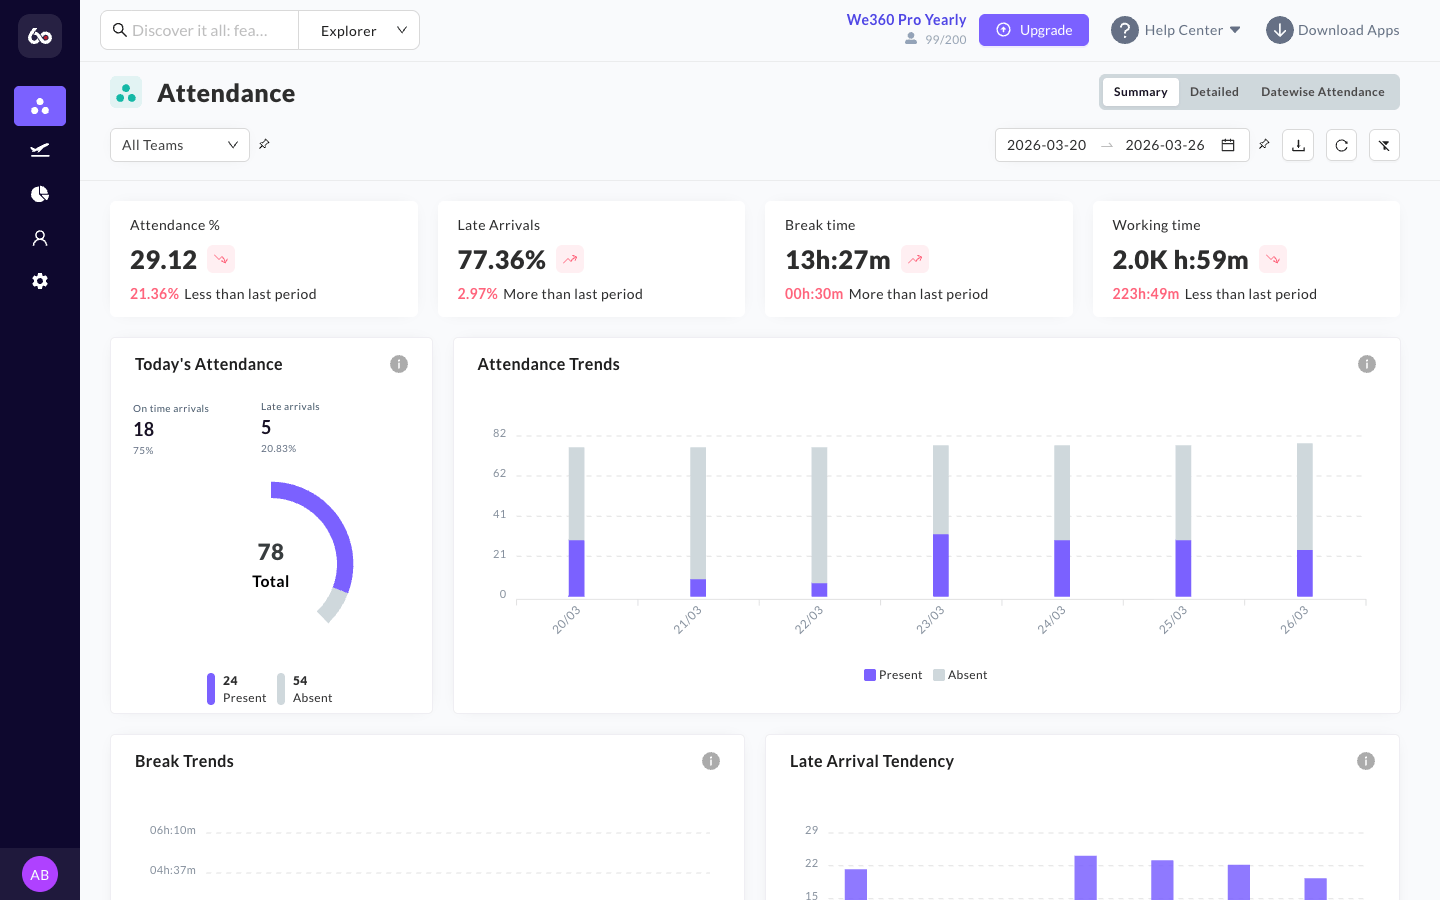
\* \*\*Overwork Flags\*\*: Triggers warnings for employees who consistently work beyond their designated shift hours (e.g., answering emails at midnight). \* \*\*Break Violations\*\*: Highlights users who skip breaks or work continuous stretches without pause, allowing HR to intervene proactively to maintain employee health and compliance with labor laws.

<figure><img src="/files/Nbr5pimIR7szuYO2u0AO" alt="Wellness360 dashboard"><figcaption><p>Wellness360 identifying overwork patterns and break violations.</p></figcaption></figure>

</details>

## Manual Time

{% hint style="success" %}
**Industry-unique feature:** We360.ai's Manual Time workflow is a capability not found in competing platforms, ensuring no legitimate work goes unrecorded.
{% endhint %}

Sometimes tracking is interrupted, or an employee conducts necessary work away from their monitored device (e.g., an in-person workshop or an extended phone call on a non-monitored, personal line).

<details>

<summary>Features</summary>

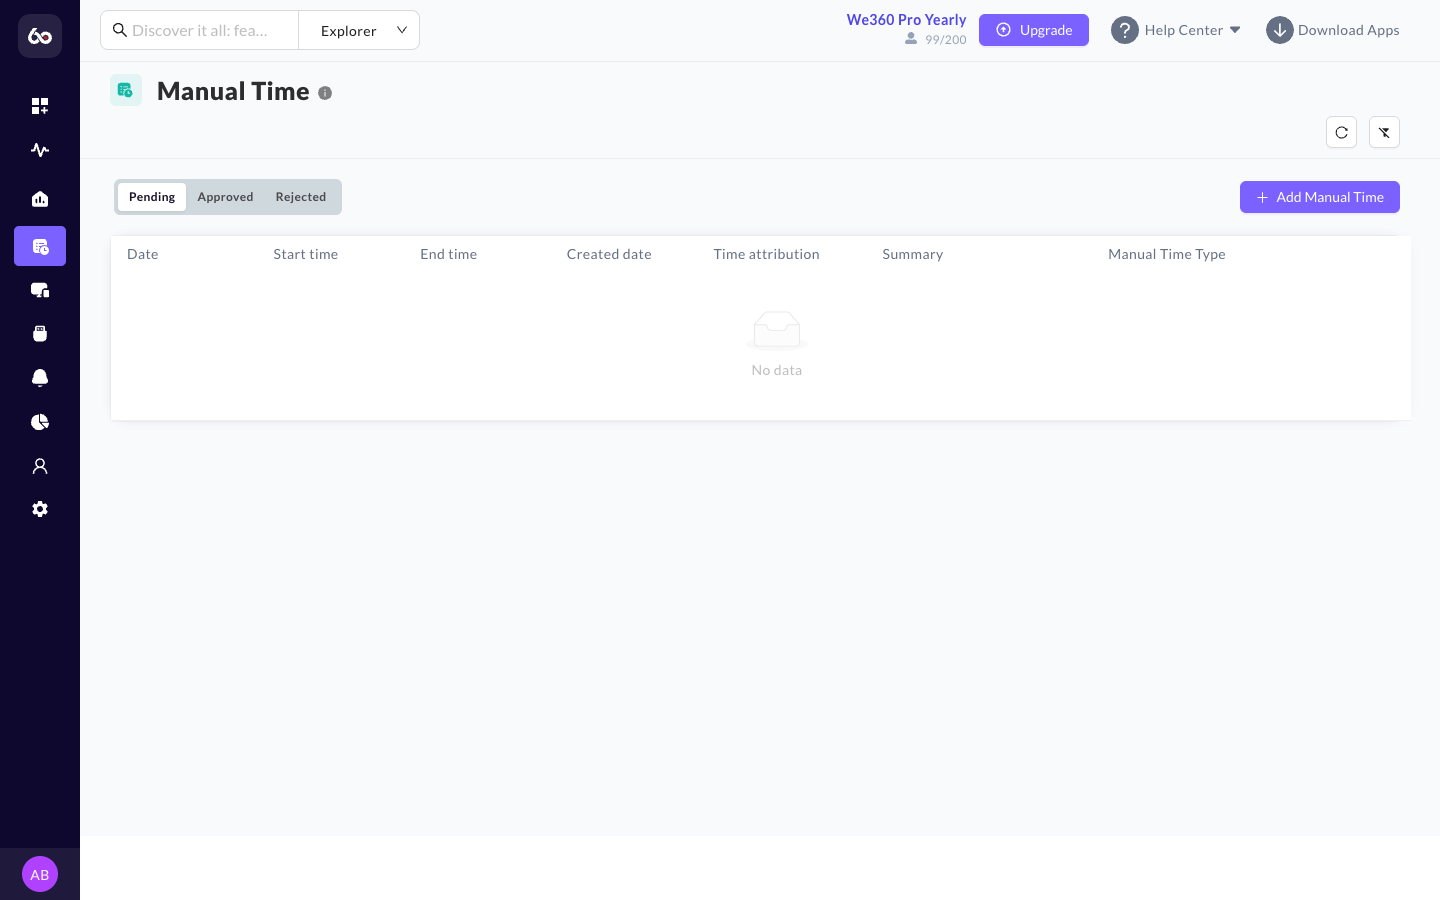
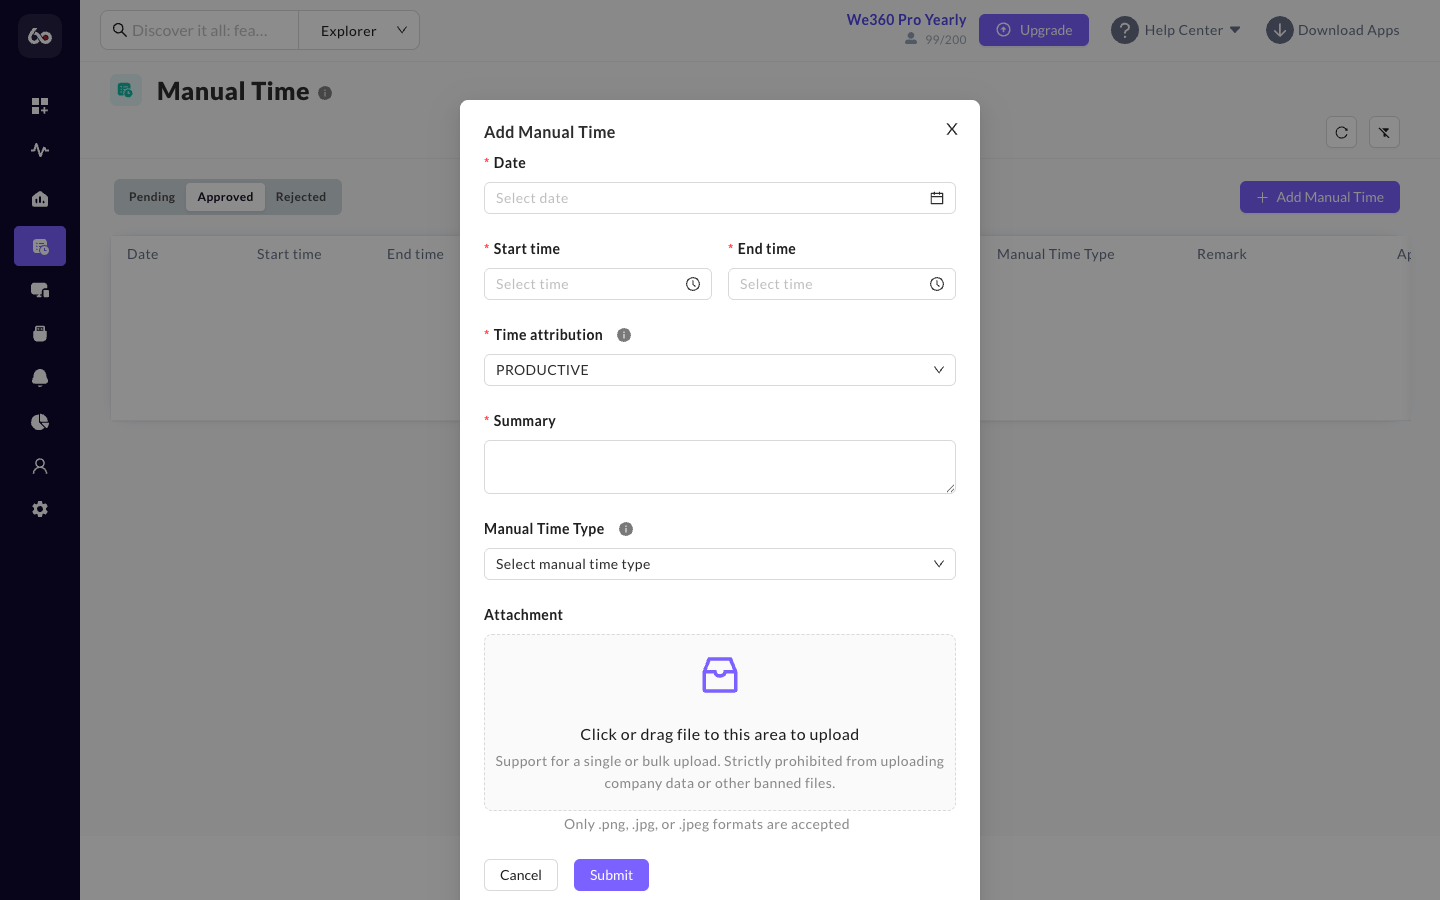
* **Request Submissions**: **Manual Time** allows users to retroactively log hours into the system via a formal request form. Entries can only be submitted for **previous dates** (not the current date).
* **Status Flow**: Each manual time entry follows a defined workflow: **Pending -> Approved/Rejected**. Once an entry is approved, it **cannot be edited**. Employees can delete their own entries while they are still in Pending status.
* **Managerial Approval**: These entries are visually distinct from automated tracking and require managerial approval before being added to the final Timesheet or Attendance log. Managers approve entries for employees within their **team hierarchy**. This ensures accuracy without sacrificing accountability.

<figure><img src="/files/wbA38UK7MbgEvJh7qluV" alt="Manual Time entries list"><figcaption><p>Manual Time log showing submitted time entries and their approval status.</p></figcaption></figure>

<figure><img src="/files/eUWcxRxiD0b1V4KQ1aYC" alt="Manual Time request form"><figcaption><p>The Manual Time request form for logging untracked hours.</p></figcaption></figure>

</details>

## Devices & USB Detection

IT Administrators require hardware-level context for the endpoints they are tracking.

<details>

<summary>Features</summary>

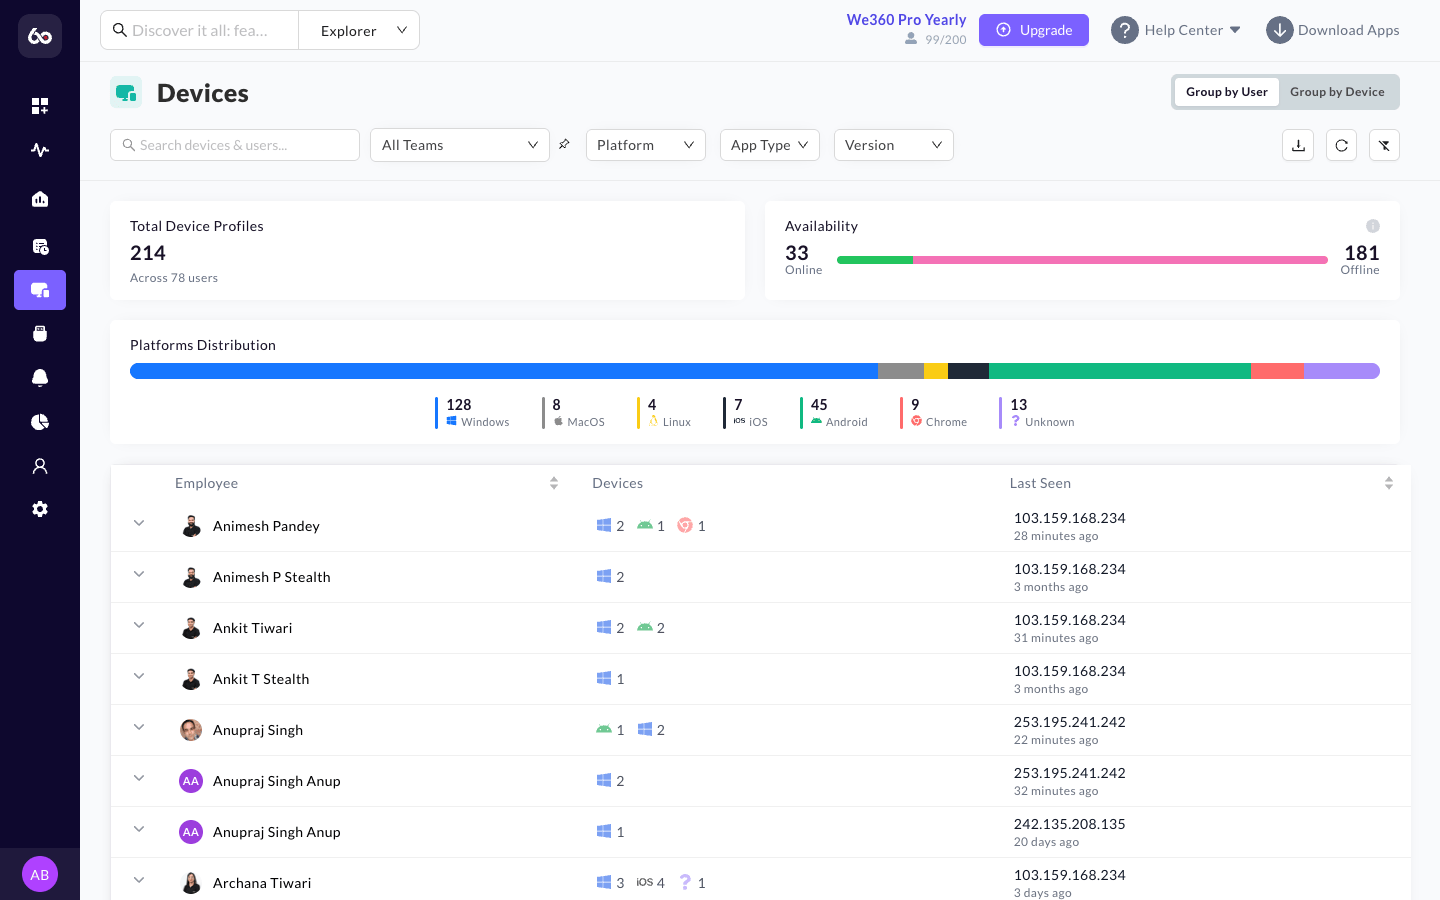
* **Device360**: Displays comprehensive metadata about the endpoint device running the agent. The Devices section is organized into three tabs:
  * **PC Tab**: Shows an **online/offline status donut chart**, **platform distribution** (Windows/macOS/Linux), and a detailed device table with columns for MyZen agent version, app type (standard or stealth), OS information, and IP address.
  * **Mobile Tab**: Shows mobile device analytics for employees using the We360.ai mobile app.
  * **Health Status Tab**: Displays device health metrics to help IT teams identify endpoints that may need attention.
* **USB Detection**: A security compliance feature that logs **connect and disconnect events** for USB devices on monitored machines. Important privacy note: USB Detection tracks events only and does **not** track or specify the USB device type (privacy by design). Logged data includes **timestamp, event type, title, user, and email**.

<figure><img src="/files/FEBTBUsritJIlz9UbVWh" alt="Device inventory"><figcaption><p>Device360 showing endpoint metadata including OS, hardware IDs, and IP addresses.</p></figcaption></figure>

</details>


---

# Agent Instructions: Querying This Documentation

If you need additional information that is not directly available in this page, you can query the documentation dynamically by asking a question.

Perform an HTTP GET request on the current page URL with the `ask` query parameter:

```
GET https://docs.we360.ai/reference/work-and-time-management/user-interfaces/portal/productivity-suite/supplemental-tracking.md?ask=<question>
```

The question should be specific, self-contained, and written in natural language.
The response will contain a direct answer to the question and relevant excerpts and sources from the documentation.

Use this mechanism when the answer is not explicitly present in the current page, you need clarification or additional context, or you want to retrieve related documentation sections.