# Reports

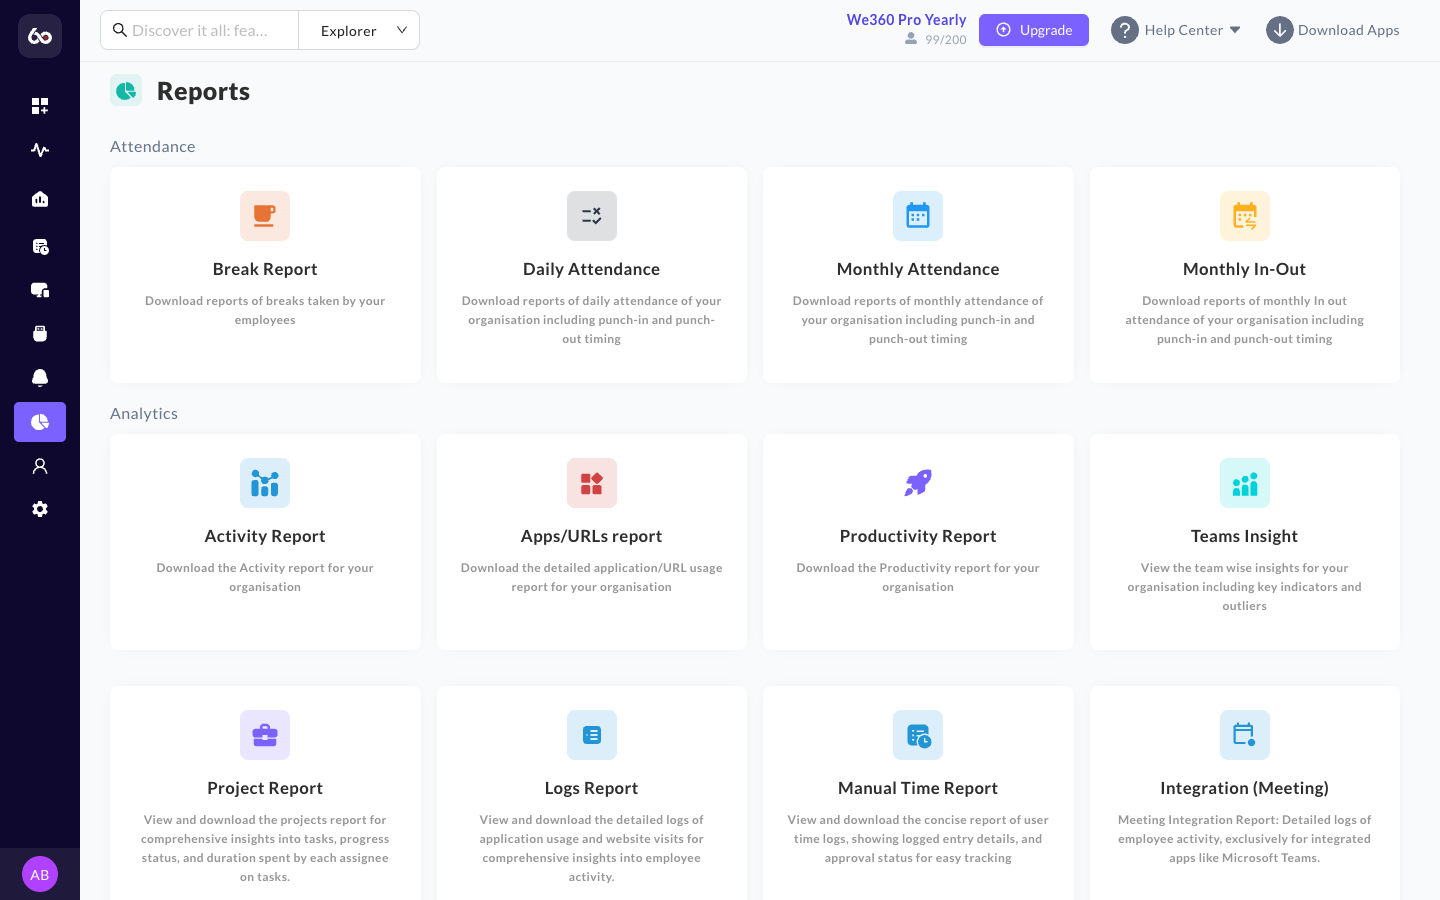
Visual dashboards are excellent for daily management, but deep auditing and cross-platform integrations require raw data. The **Reports** module provides a categorized library of downloadable exports, covering every conceivable metric tracked by the We360.ai Agent.

<figure><img src="/files/jwFgwxKbccmatOFhiyxN" alt="Reports module showing all available report cards"><figcaption><p>Reports module overview with all available report types</p></figcaption></figure>

## Categories

<details>

<summary>Attendance &#x26; Time</summary>

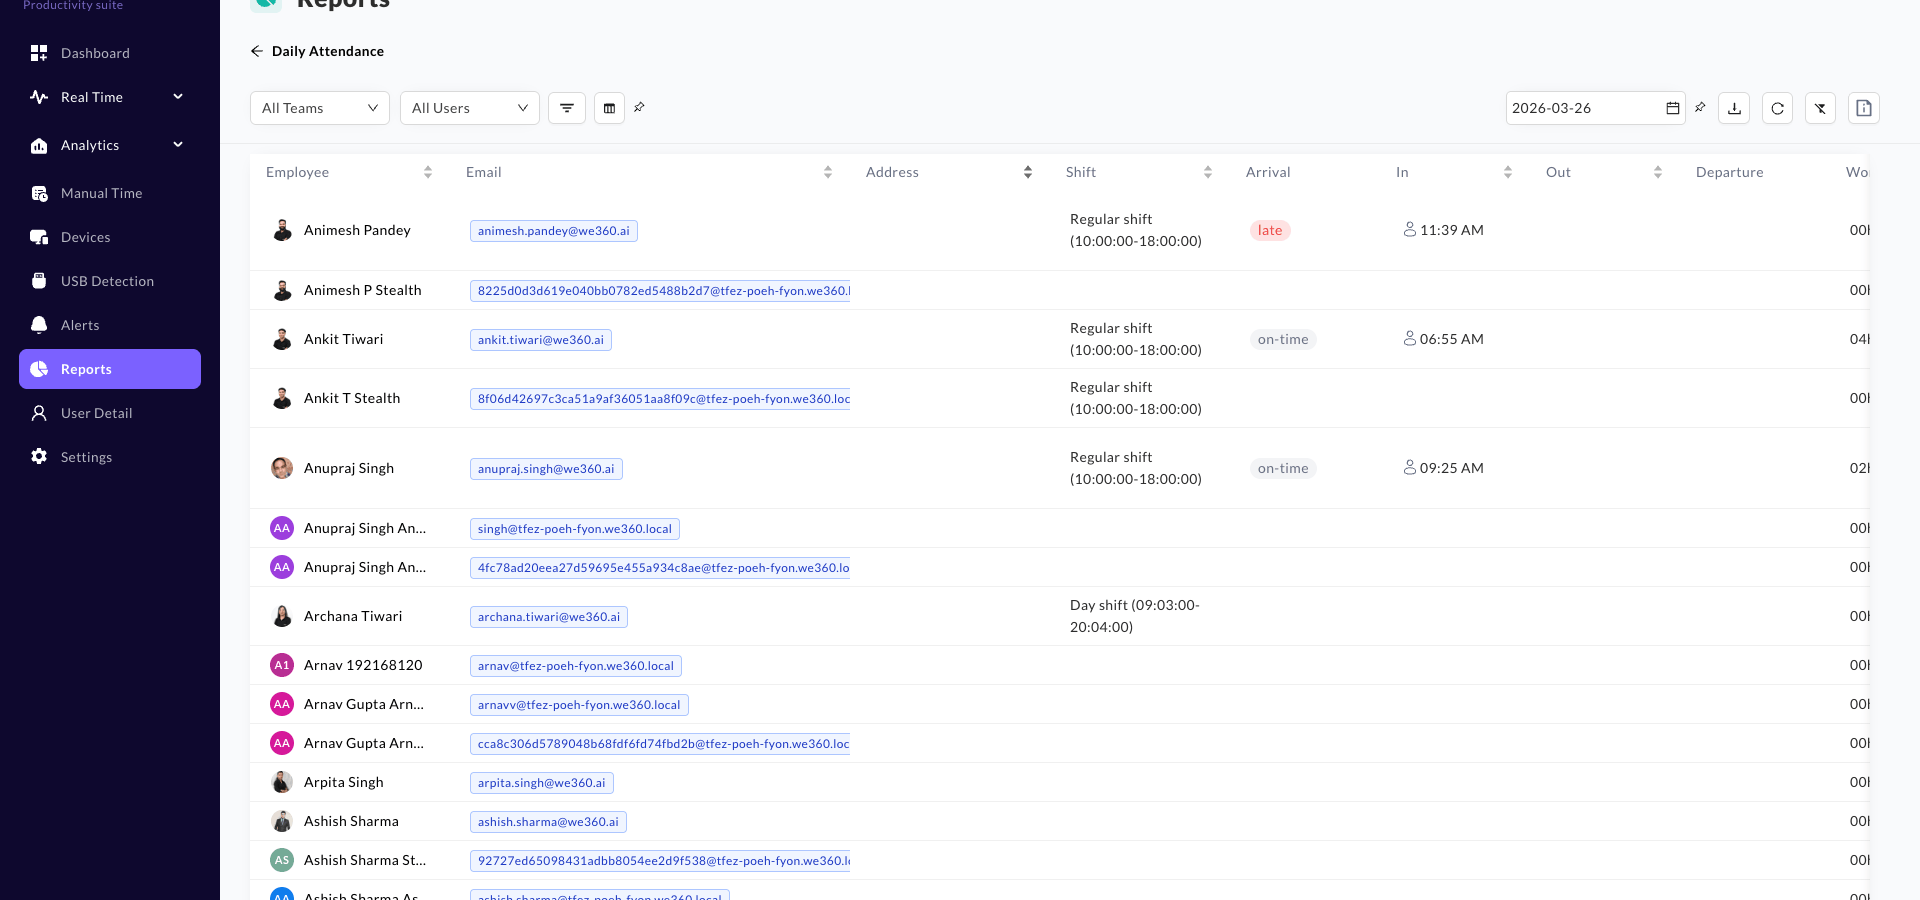
* **Daily Attendance**: Displays daily shift details, punch times, work duration, and smart attendance remarks like full day, short presence, or absent. The table includes columns for employee name, assigned shift, arrival status (early/late/on-time), in time, out time, departure status (early/late/on-time), working time, and online time. Available as CSV download.
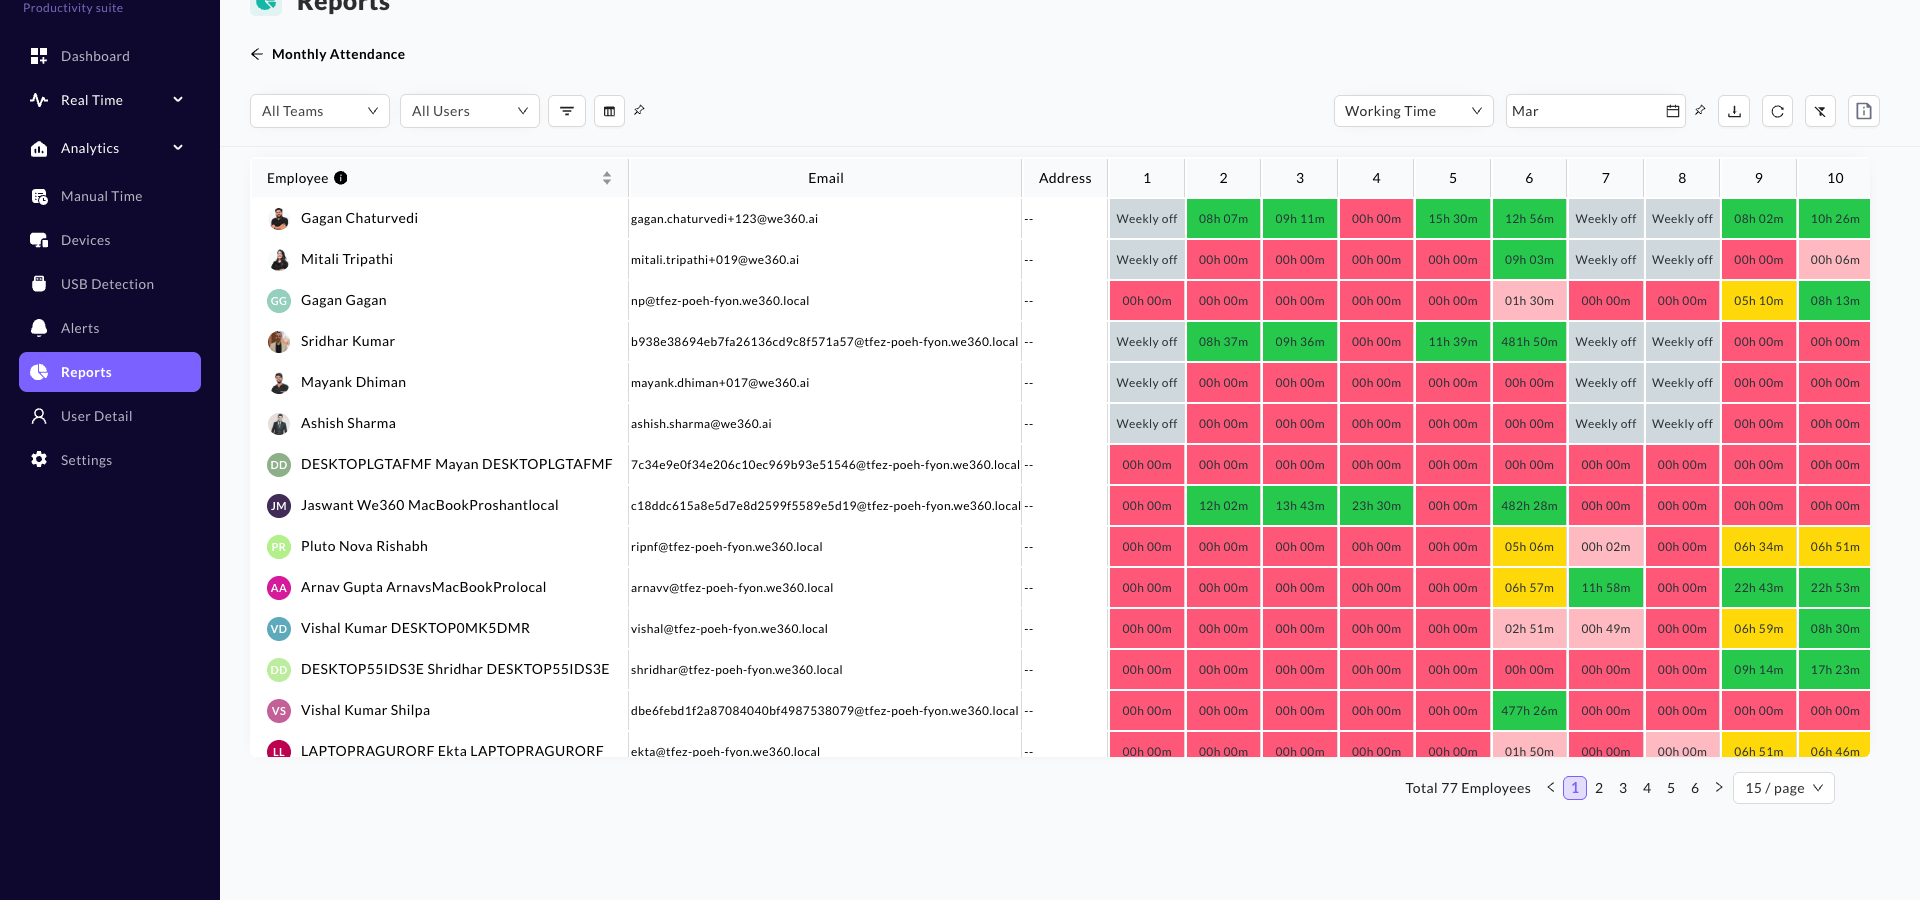
* **Monthly Attendance**: View a complete month's attendance breakdown by day, with total present, absent, and working hours -- filtered by team, user, or time type.

<figure><img src="/files/aIQJIVYAn4JfIWmOZDmw" alt="Daily Attendance report"><figcaption><p>Daily Attendance Report</p></figcaption></figure>

<figure><img src="/files/3xDNyAPHgHnjWIj72Q3d" alt="Monthly Attendance report"><figcaption><p>Monthly Attendance Report</p></figcaption></figure>

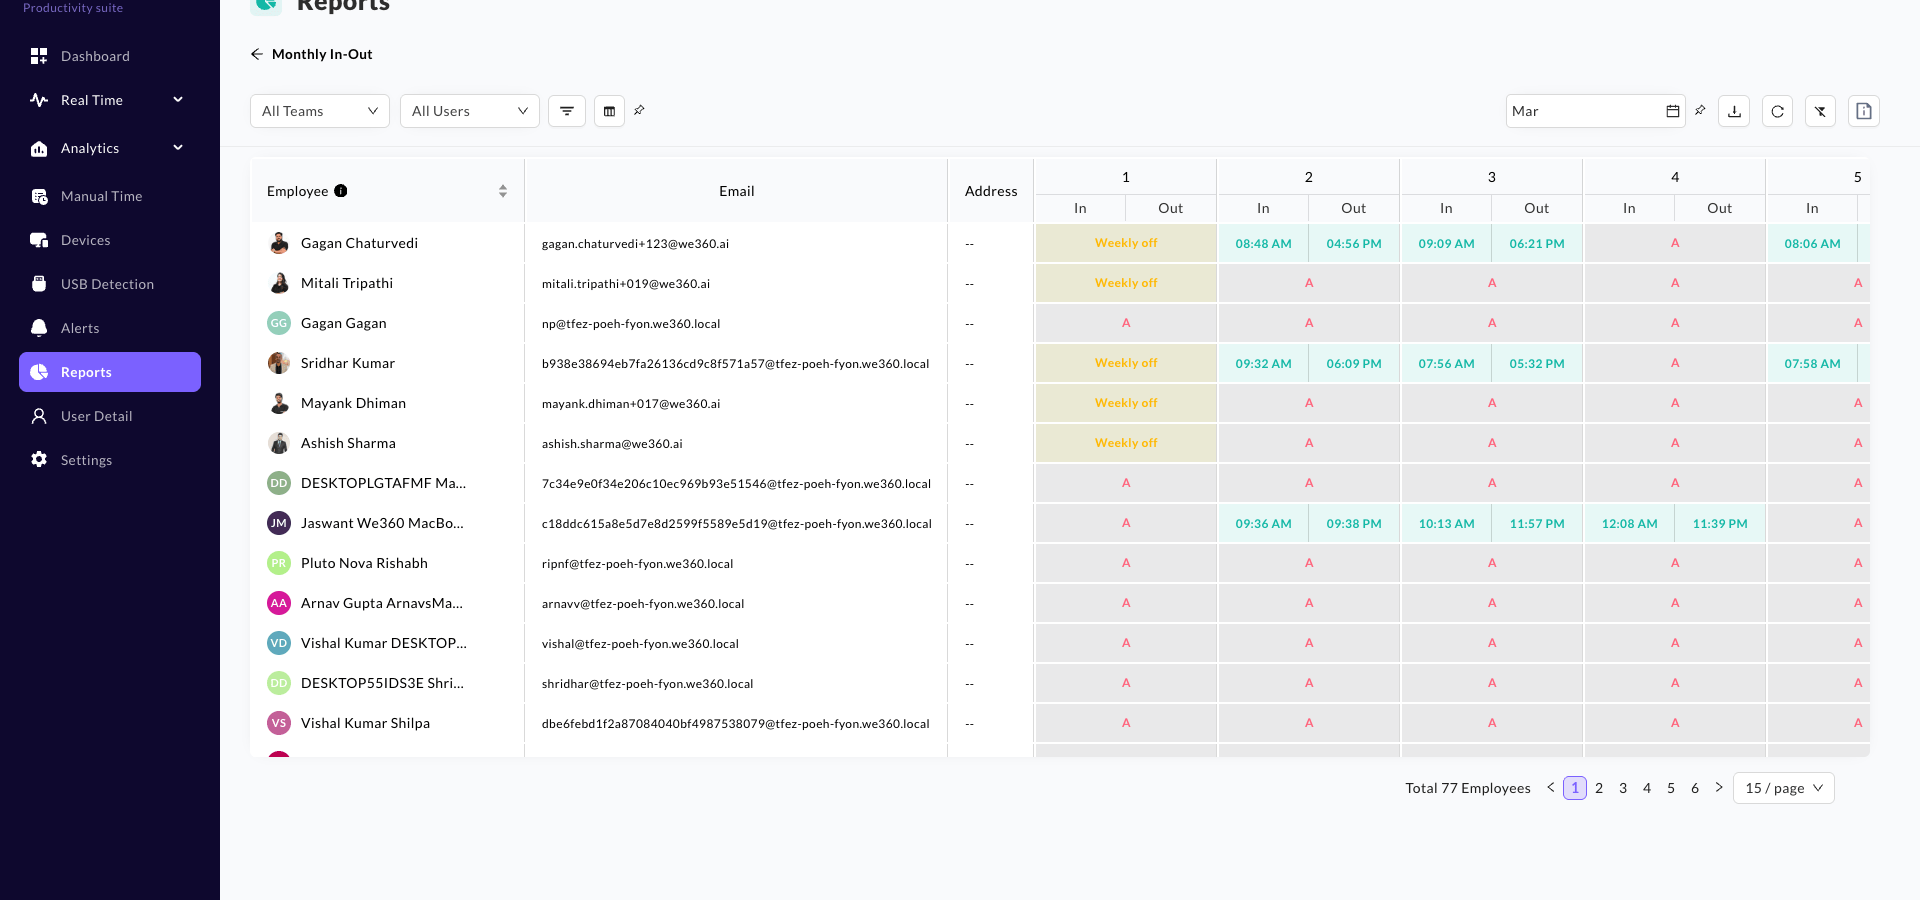
* **Monthly In-Out**: Track exact punch-in/punch-out times across the month, including absences and weekly offs, for every employee in one clear view.

<figure><img src="/files/UEpryfY8h9fPbCnOMMjq" alt="Monthly In-Out report"><figcaption><p>Monthly In-Out Report</p></figcaption></figure>

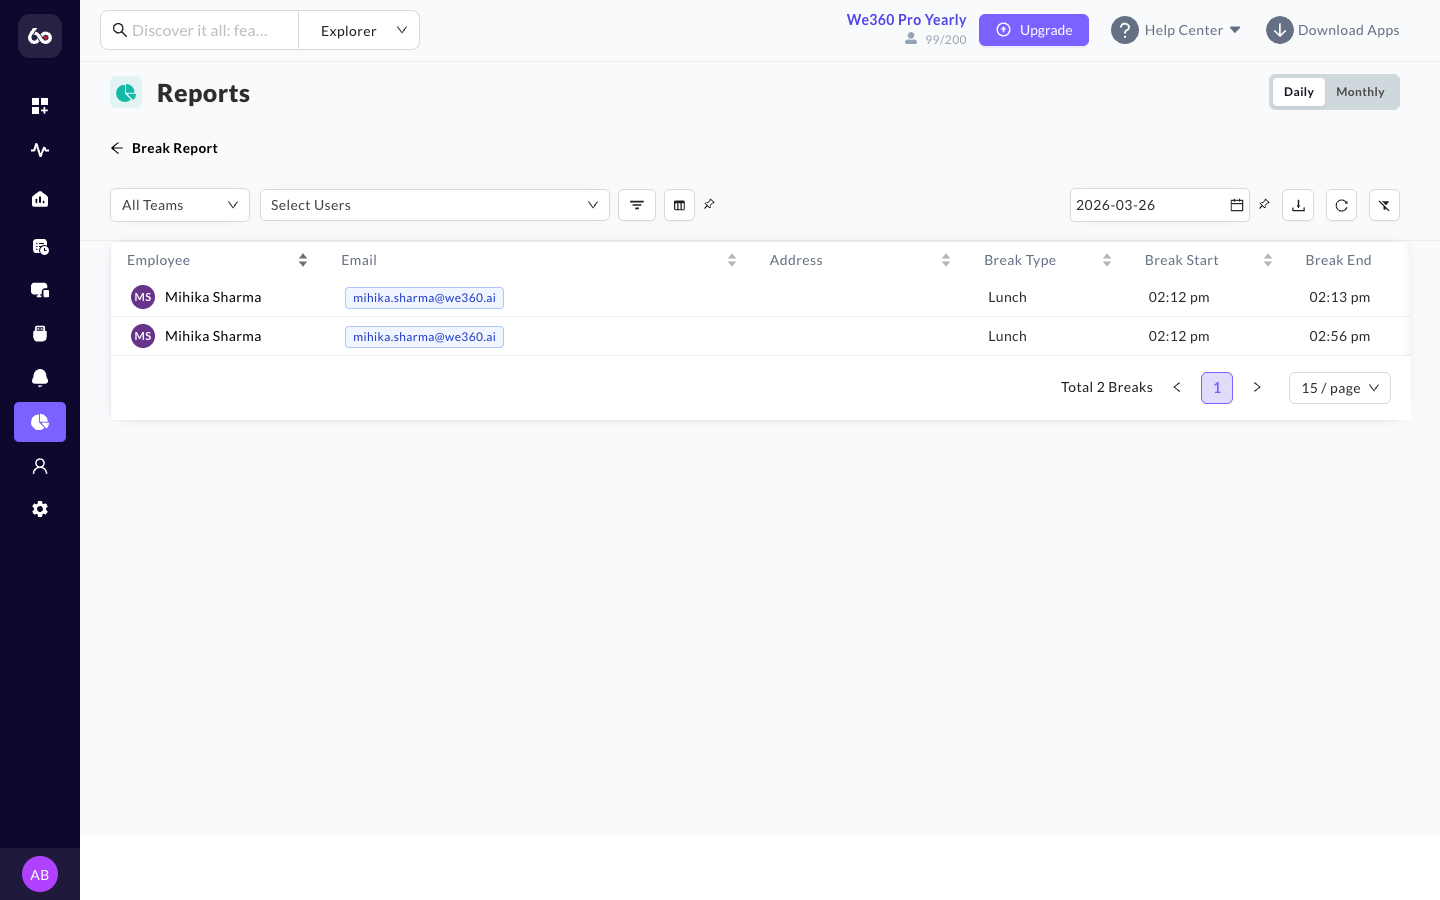
* **Break Report**: Get a clear view of when, how often, and how long employees take breaks -- daily or monthly -- so you stay informed and balanced. The report presents break data in a tabular format with columns for break type, start time, end time, and duration. Each column is sortable. Available as CSV download.

<figure><img src="/files/U2cOurxUbVGqABslvIdk" alt="Break Report"><figcaption><p>Break Report</p></figcaption></figure>

* **Cross-Day Attendance**: Designed specifically for night shifts or non-standard work hours that cross midnight boundaries.
* **Timesheet Report**: Export approved project hours and time allocations logged through the Timesheet module.
* **Manual Time Report**: Review every submitted manual time entry along with its approval status, summary, and attached evidence.

</details>

<details>

<summary>Analytics &#x26; Productivity</summary>

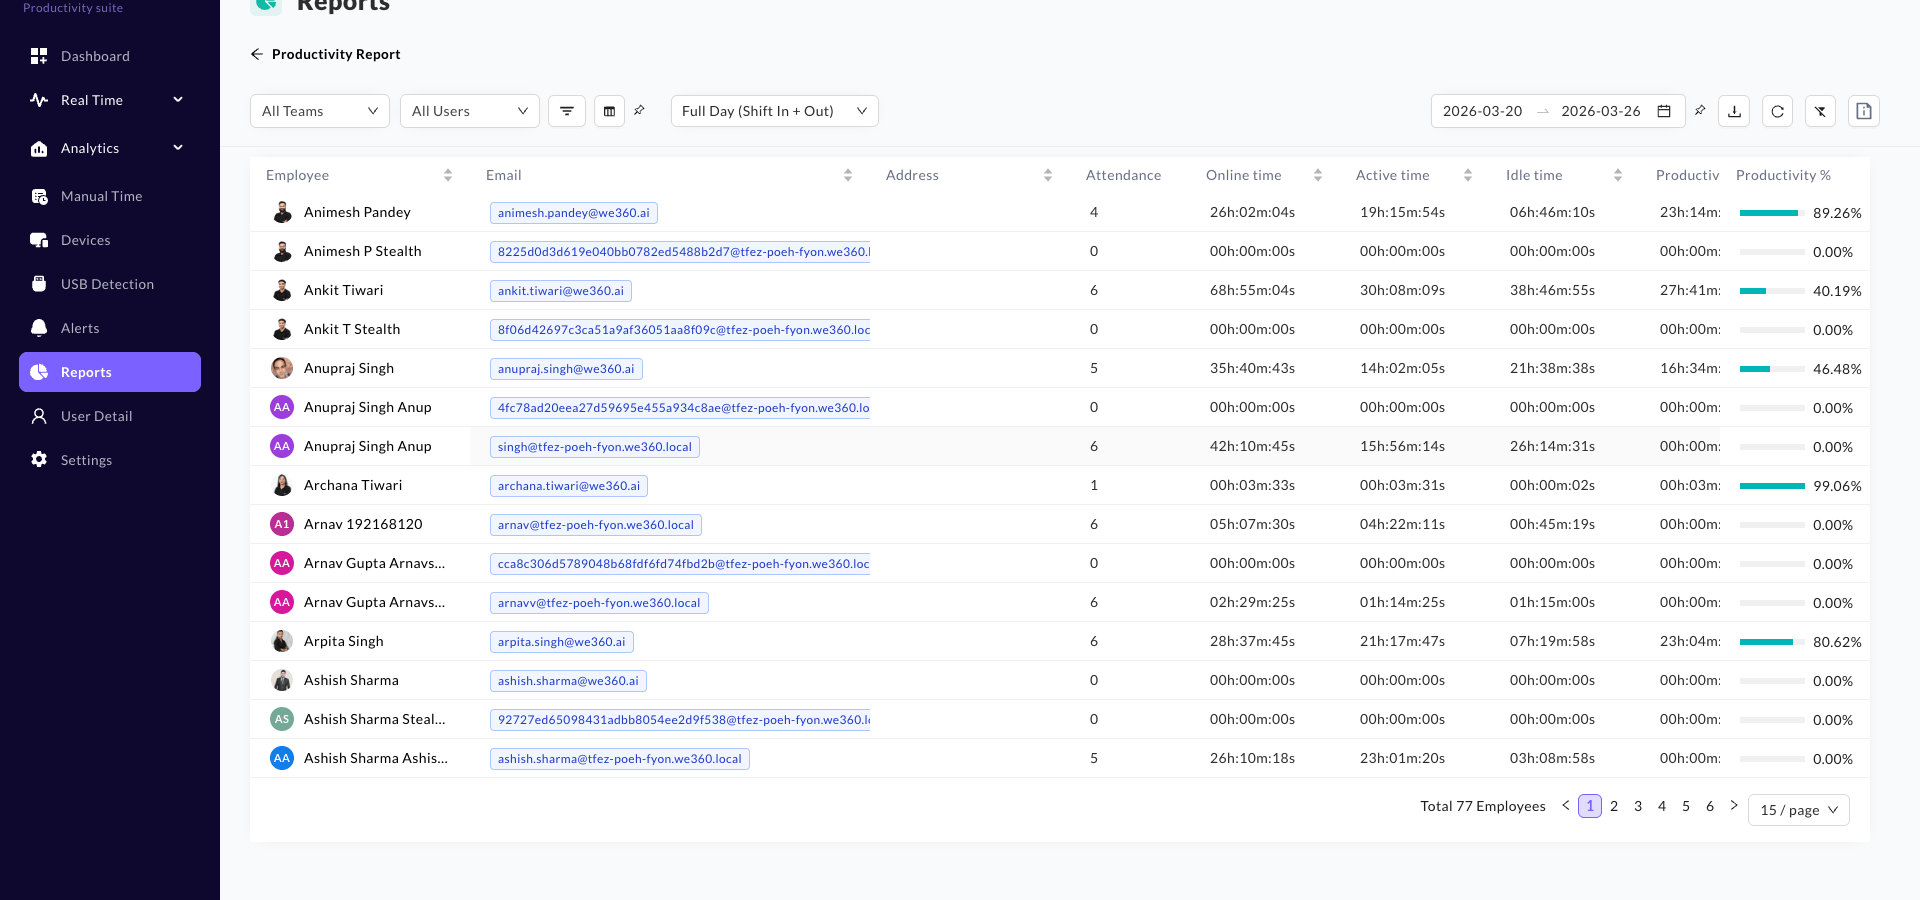
* **Productivity Report**: Shows how efficiently employees are working by breaking down their online time into productive, unproductive, neutral, and break durations. The core formula is: **Online Time = Productive Time + Unproductive Time + Neutral Time + Break Time**. Available as CSV download.

<figure><img src="/files/xSCdsiubQ5pLK4HxIovs" alt="Productivity Report"><figcaption><p>Productivity Report</p></figcaption></figure>

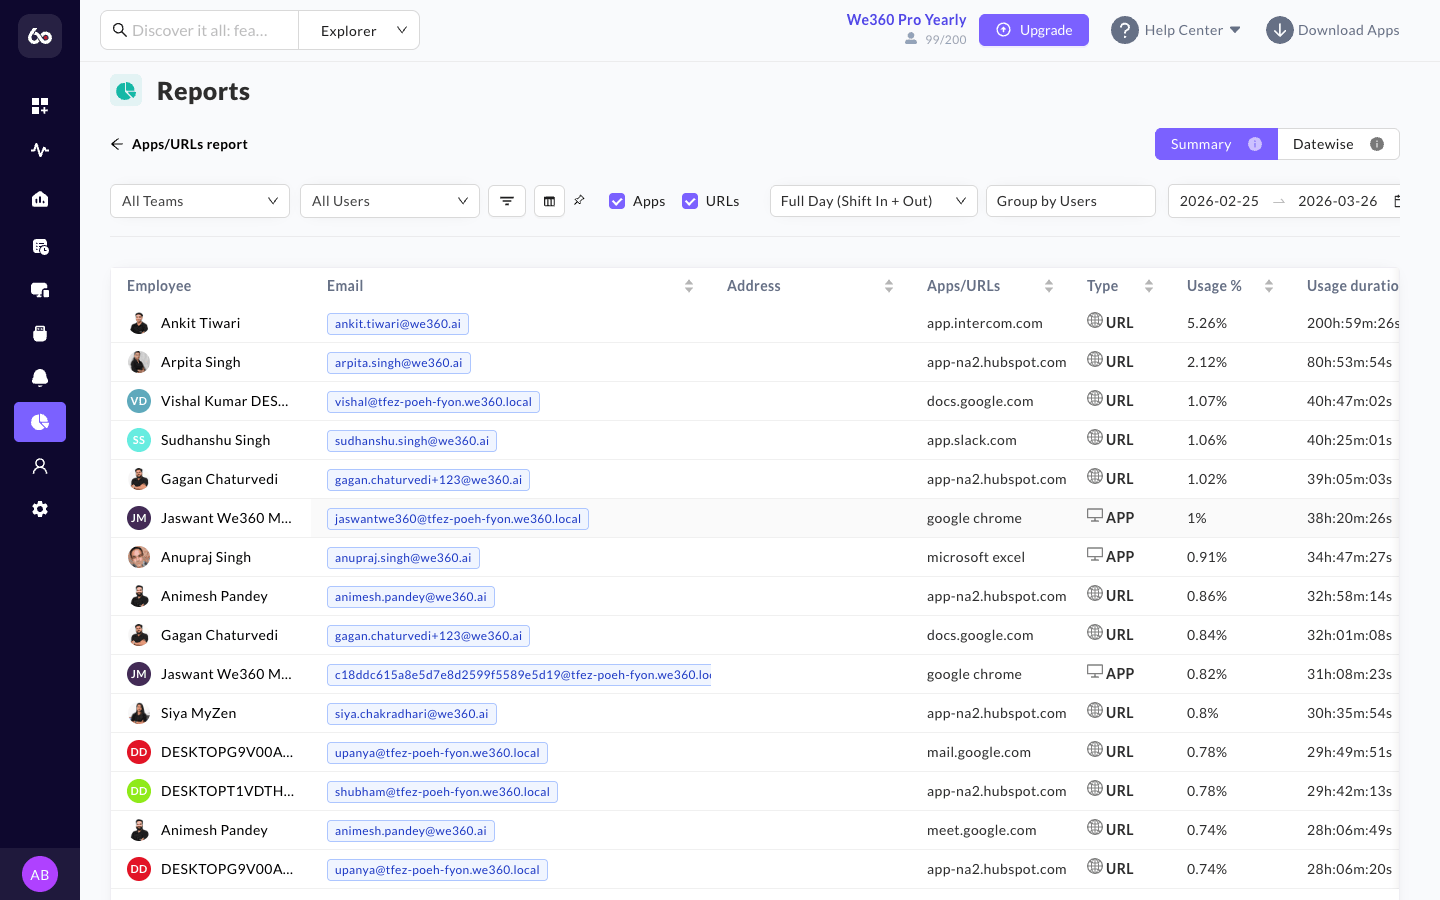
* **Apps/URL Report**: Understand where employee time goes -- track which apps and websites are used the most and for how long. Displays a graphical representation of the **top 20 applications and URLs** in descending order of usage, along with a detailed usage table with columns for Type, Details, Percentage, and Duration (each column is sortable). Two checkboxes allow you to filter between Apps usage and URL usage. Note that Apps/URL reports can only be downloaded in **PDF format**.
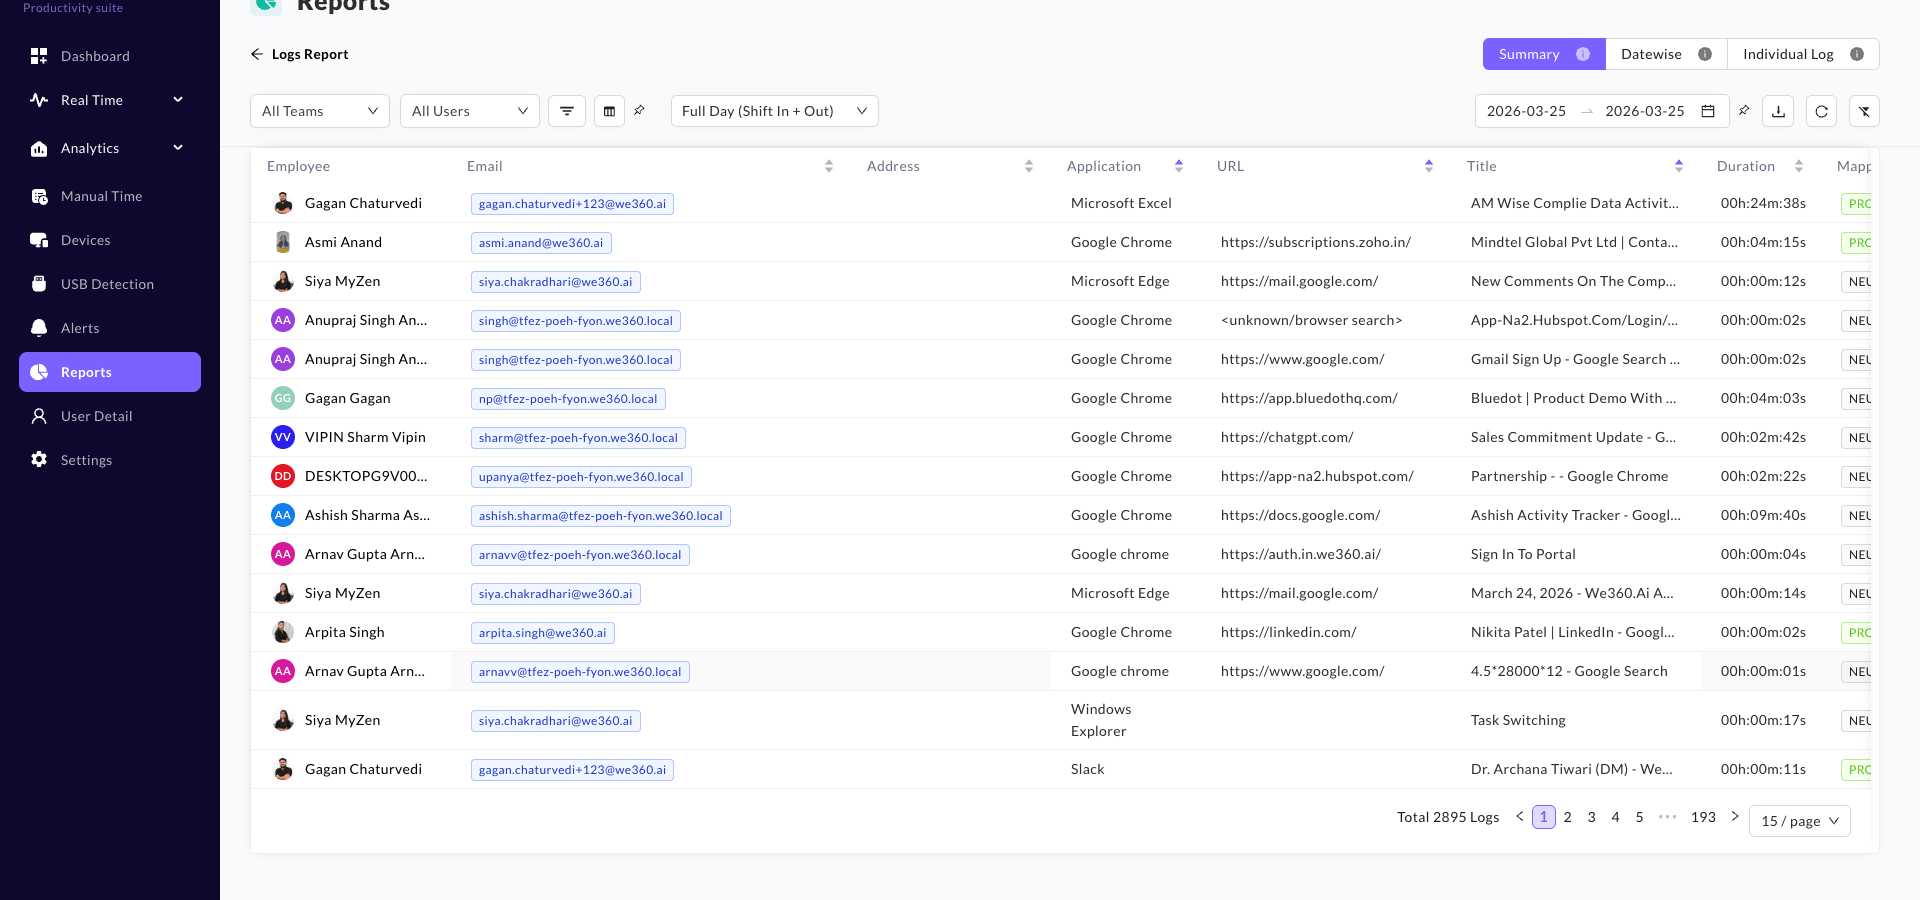
* **Logs Report (Apps & URL)**: The detailed timestamped logs of application usage and website visits for comprehensive insights into employee activity.

<figure><img src="/files/8ZJ7XJDqvp74STXH3v6I" alt="Apps/URLs Report"><figcaption><p>Apps/URLs Report</p></figcaption></figure>

<figure><img src="/files/GYCiY6Xl3XyNaE00EQvj" alt="Logs Report"><figcaption><p>Logs Report</p></figcaption></figure>

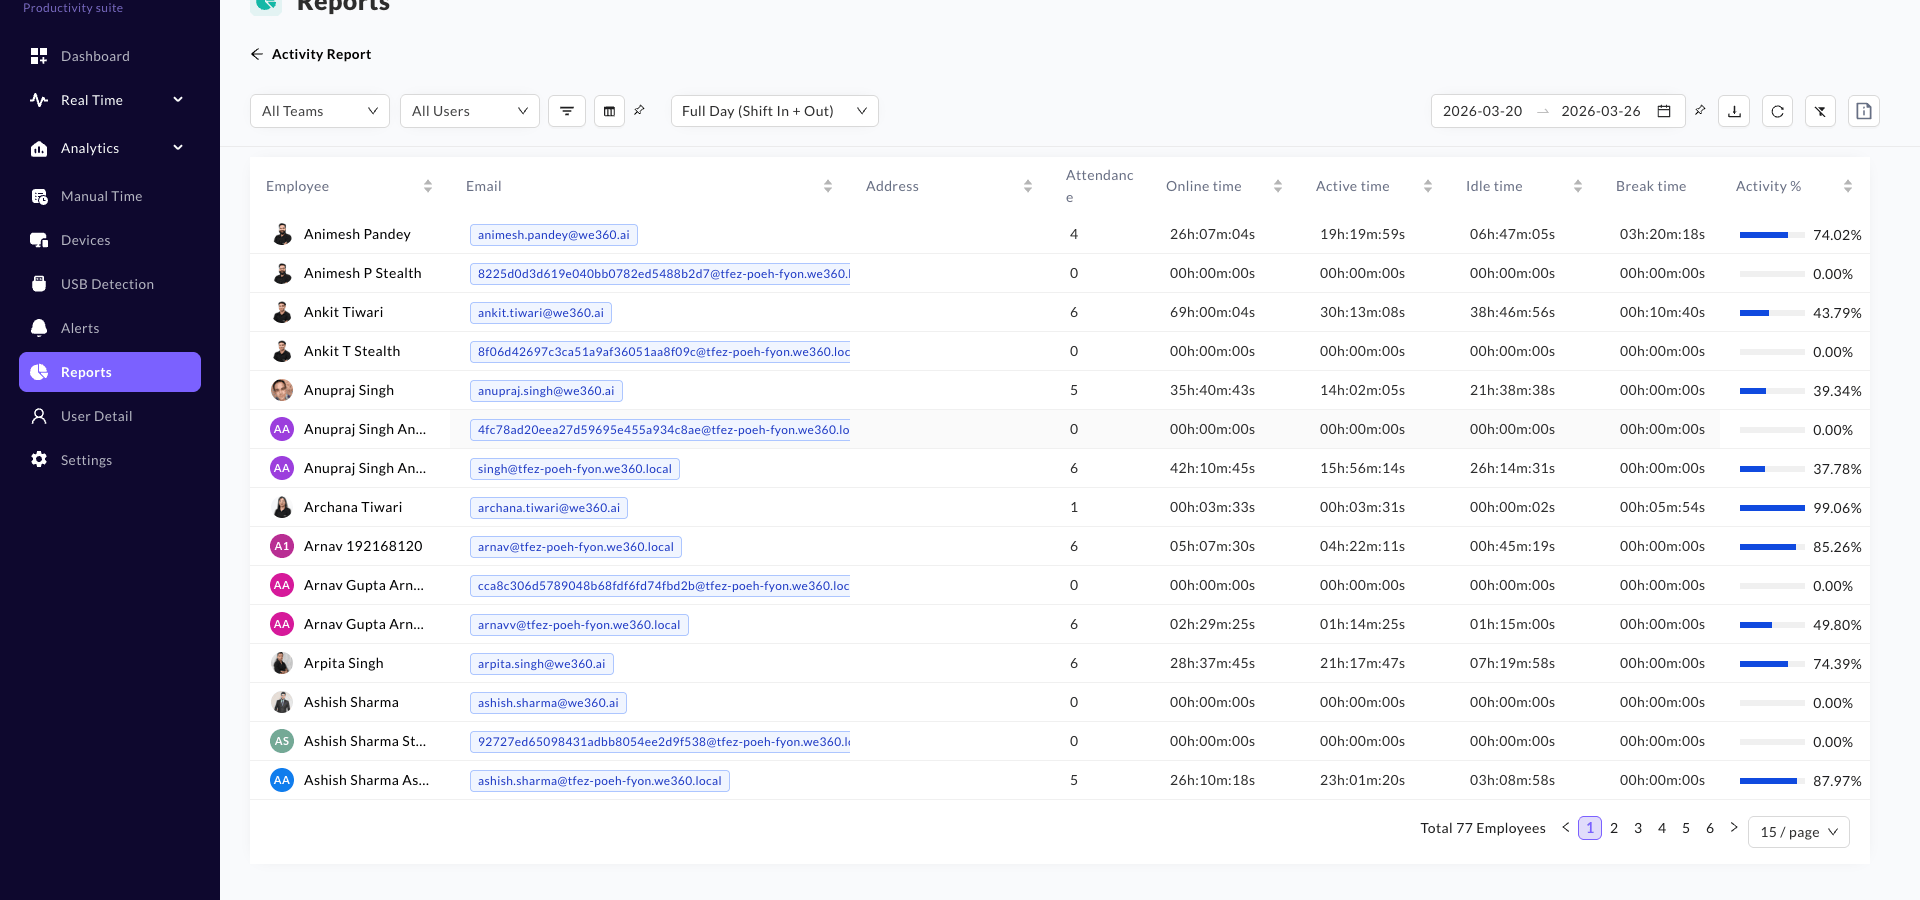
* **Activity Report**: Track how actively employees are working by monitoring their online, active, and idle time, along with keyboard and mouse activity. The core formula is: **Online Time = Active Time + Idle Time + Break Time**. The report provides an in-depth analysis of each employee's activity, including the number of key presses and mouse clicks. Available as CSV download.

<figure><img src="/files/f7a4i7wYkLr1QGXtcH2p" alt="Activity Report"><figcaption><p>Activity Report</p></figcaption></figure>

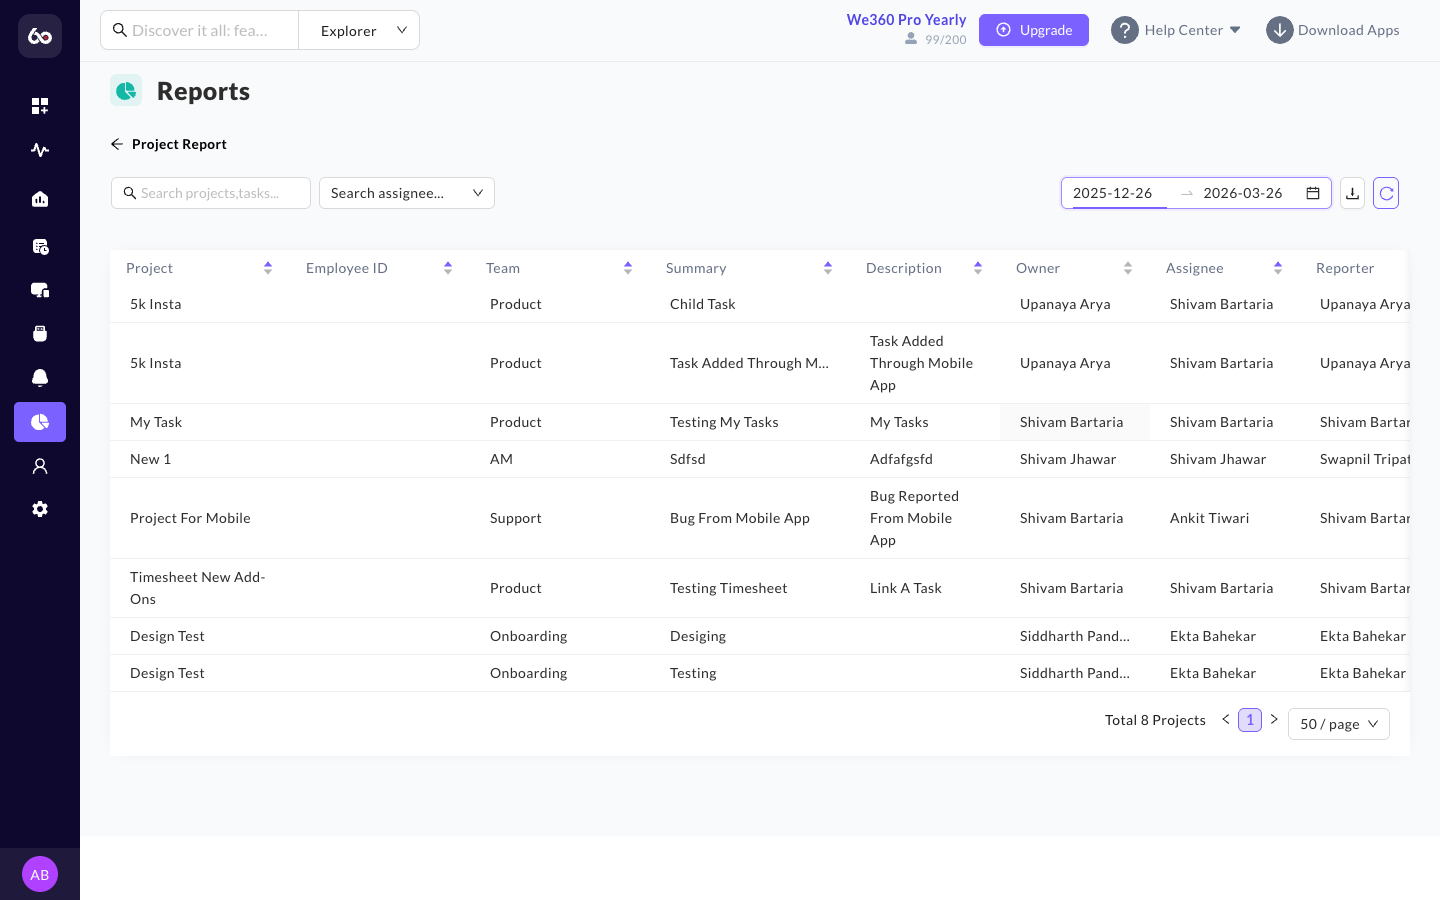
* **Project Report**: Stay on top of project accountability with a complete view of task ownership, timelines, and time tracked against deliverables.

<figure><img src="/files/3Np6aP71b6Kjl9Z5WAXS" alt="Project Report"><figcaption><p>Project Report</p></figcaption></figure>

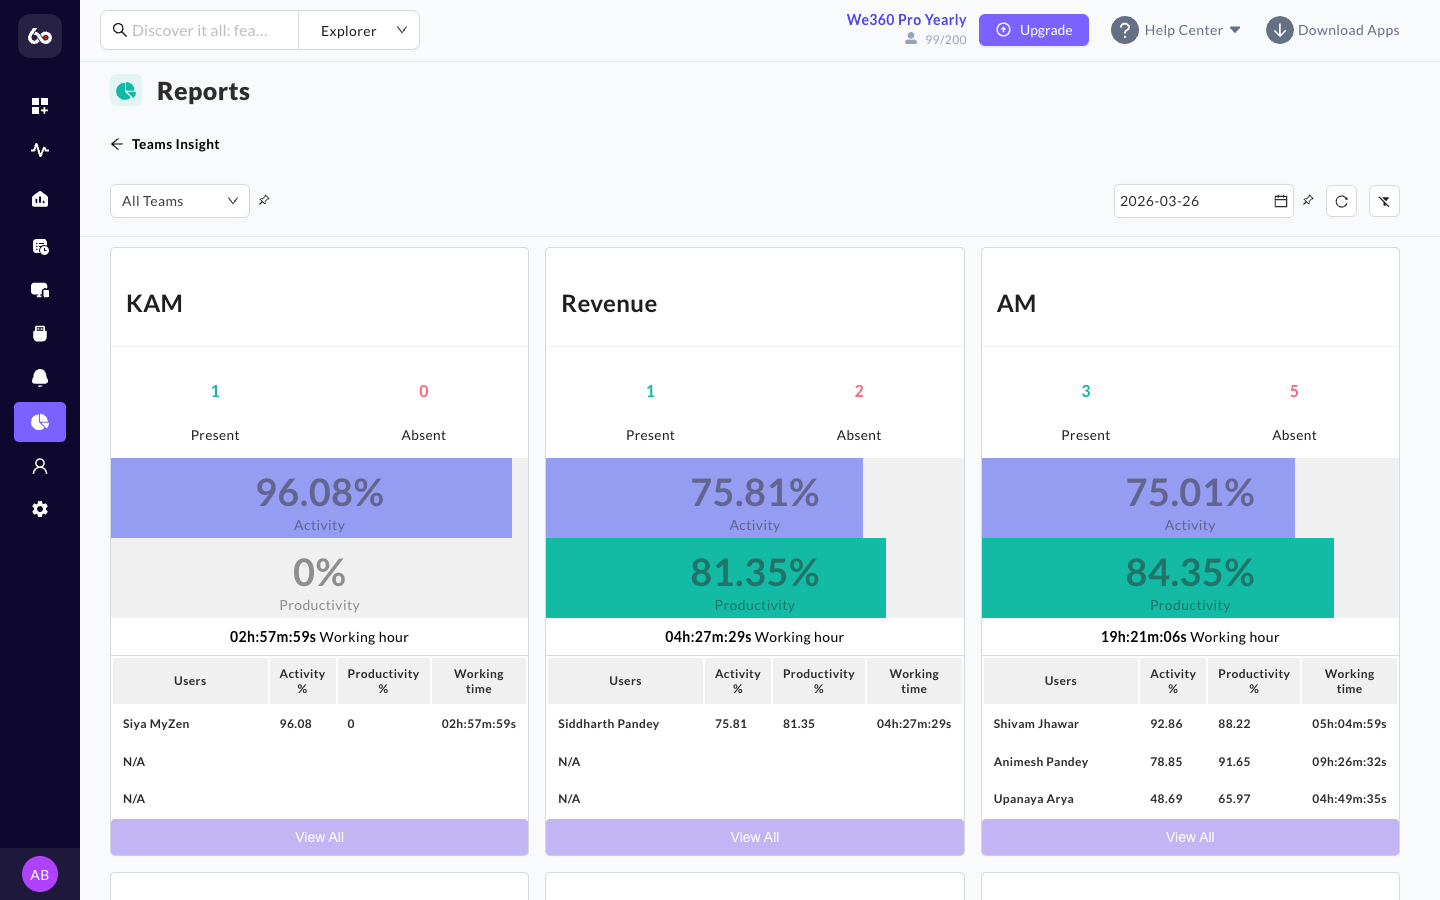
* **Teams Insight**: A visual dashboard displayed as a grid of cards, where each card represents a specific team's performance for a single day. Each card shows: **Attendance** (present and absent counts), **Activity** (average activity level), **Working Hours** (total hours worked), and **Top 3 Active Users** within the team. Use the date filter to check insights from previous days. Note: this report is view-only and cannot be downloaded.

<figure><img src="/files/EuU1J6usVigXl3UFgwXh" alt="Teams Insight report"><figcaption><p>Teams Insight Report</p></figcaption></figure>

</details>

<details>

<summary>IT &#x26; Security</summary>

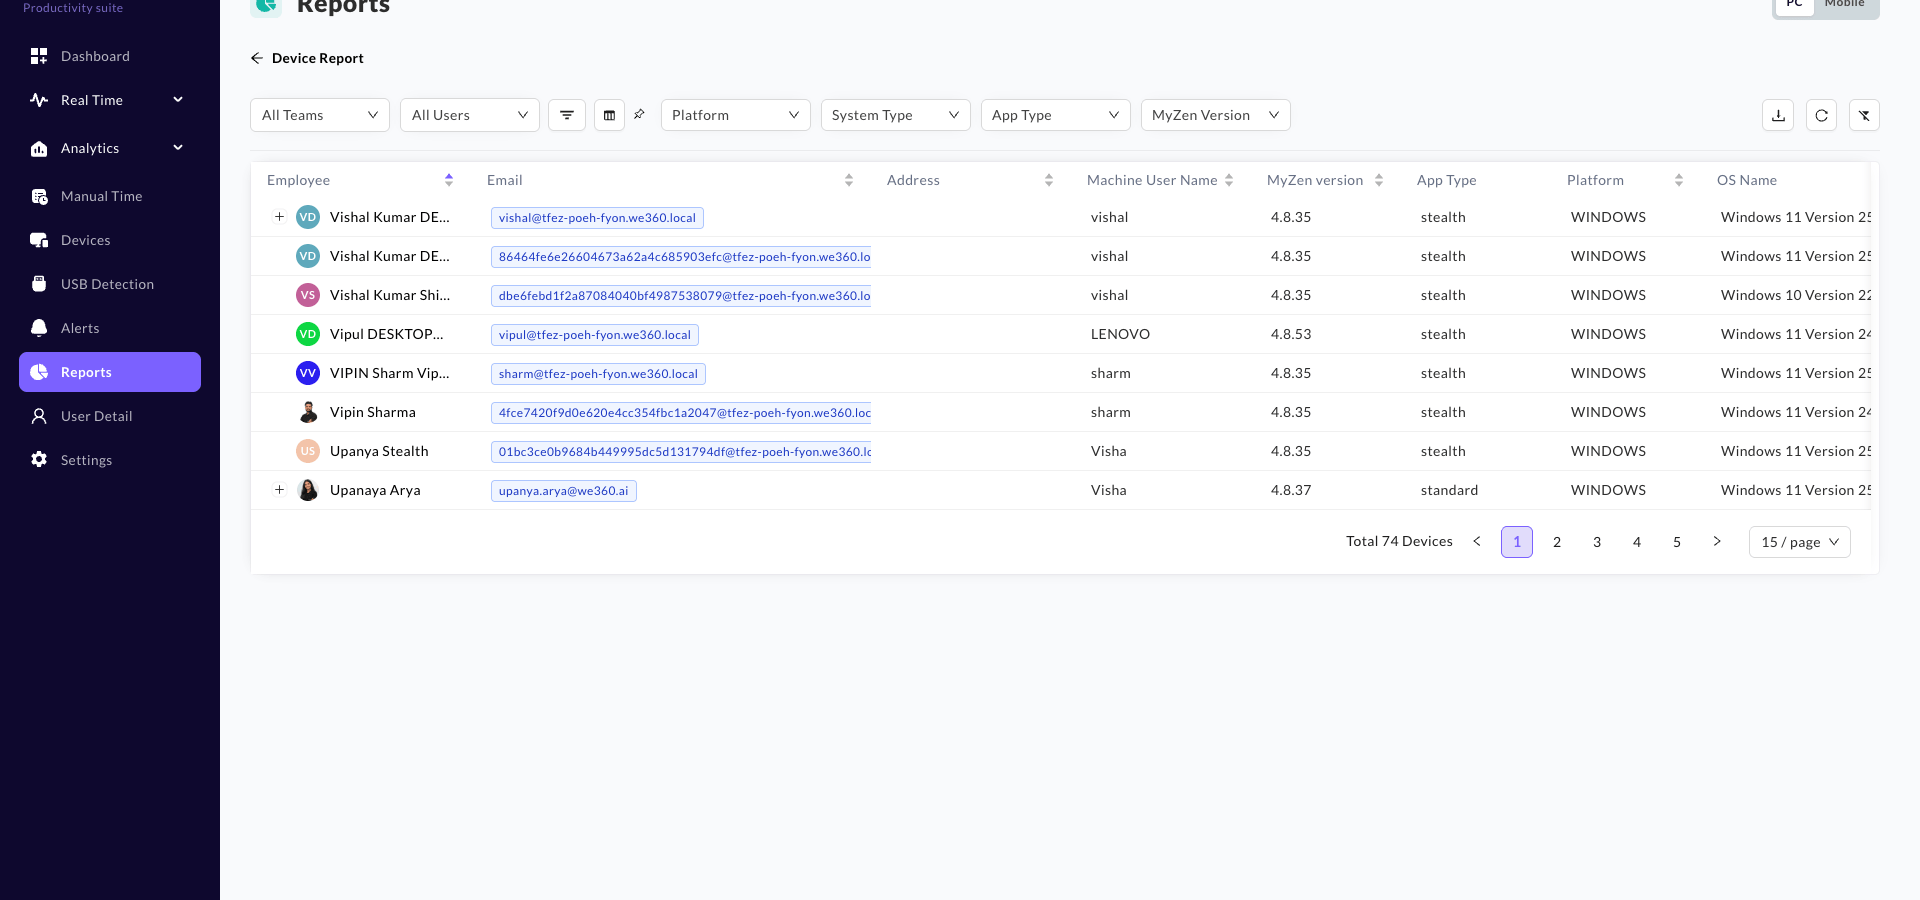
* **Device Report**: Detailed inventory of endpoints currently running the We360.ai agent (PC and Mobile), useful for asset management.

<figure><img src="/files/MgcBwSXtzbo2Y7qGh2CB" alt="Device Report"><figcaption><p>Device Report</p></figcaption></figure>

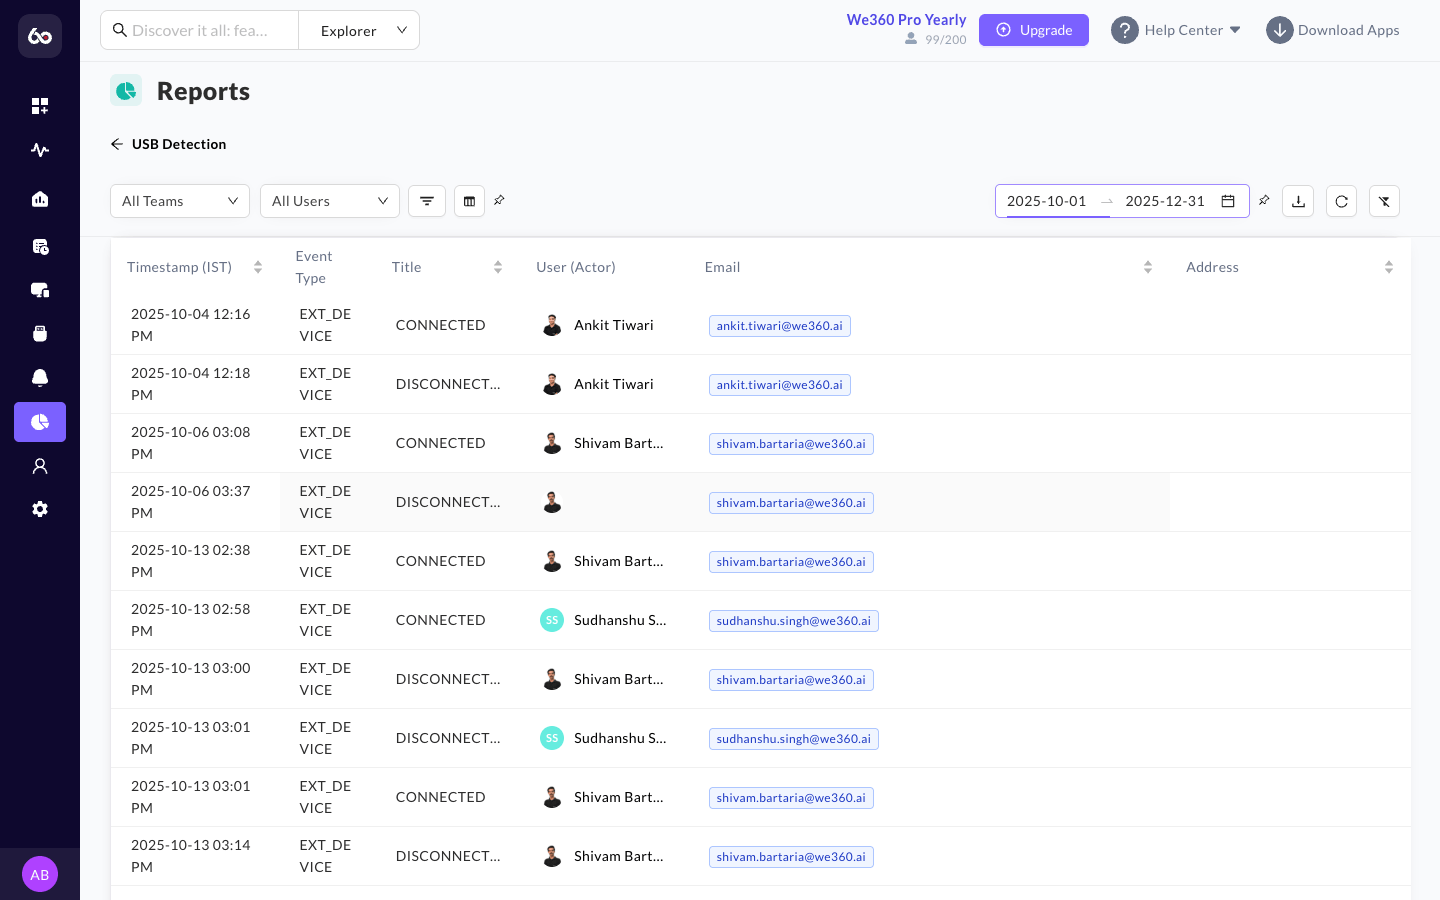
* **USB Detection**: Get real-time visibility when any USB device is connected or disconnected on an employee's system.

<figure><img src="/files/zZ3GGLQJXkvlWnOok3YD" alt="USB Detection Report"><figcaption><p>USB Detection Report</p></figcaption></figure>

* **Alert Report**: A table organizing all alerts generated for a given day, including the date of the alert, a brief description, the alert type (URL alert, application alert, overtime break alert), who the alert was triggered for, and the trigger time. The Alert Report includes only a **date filter**. Available as CSV download.

</details>

## Customization

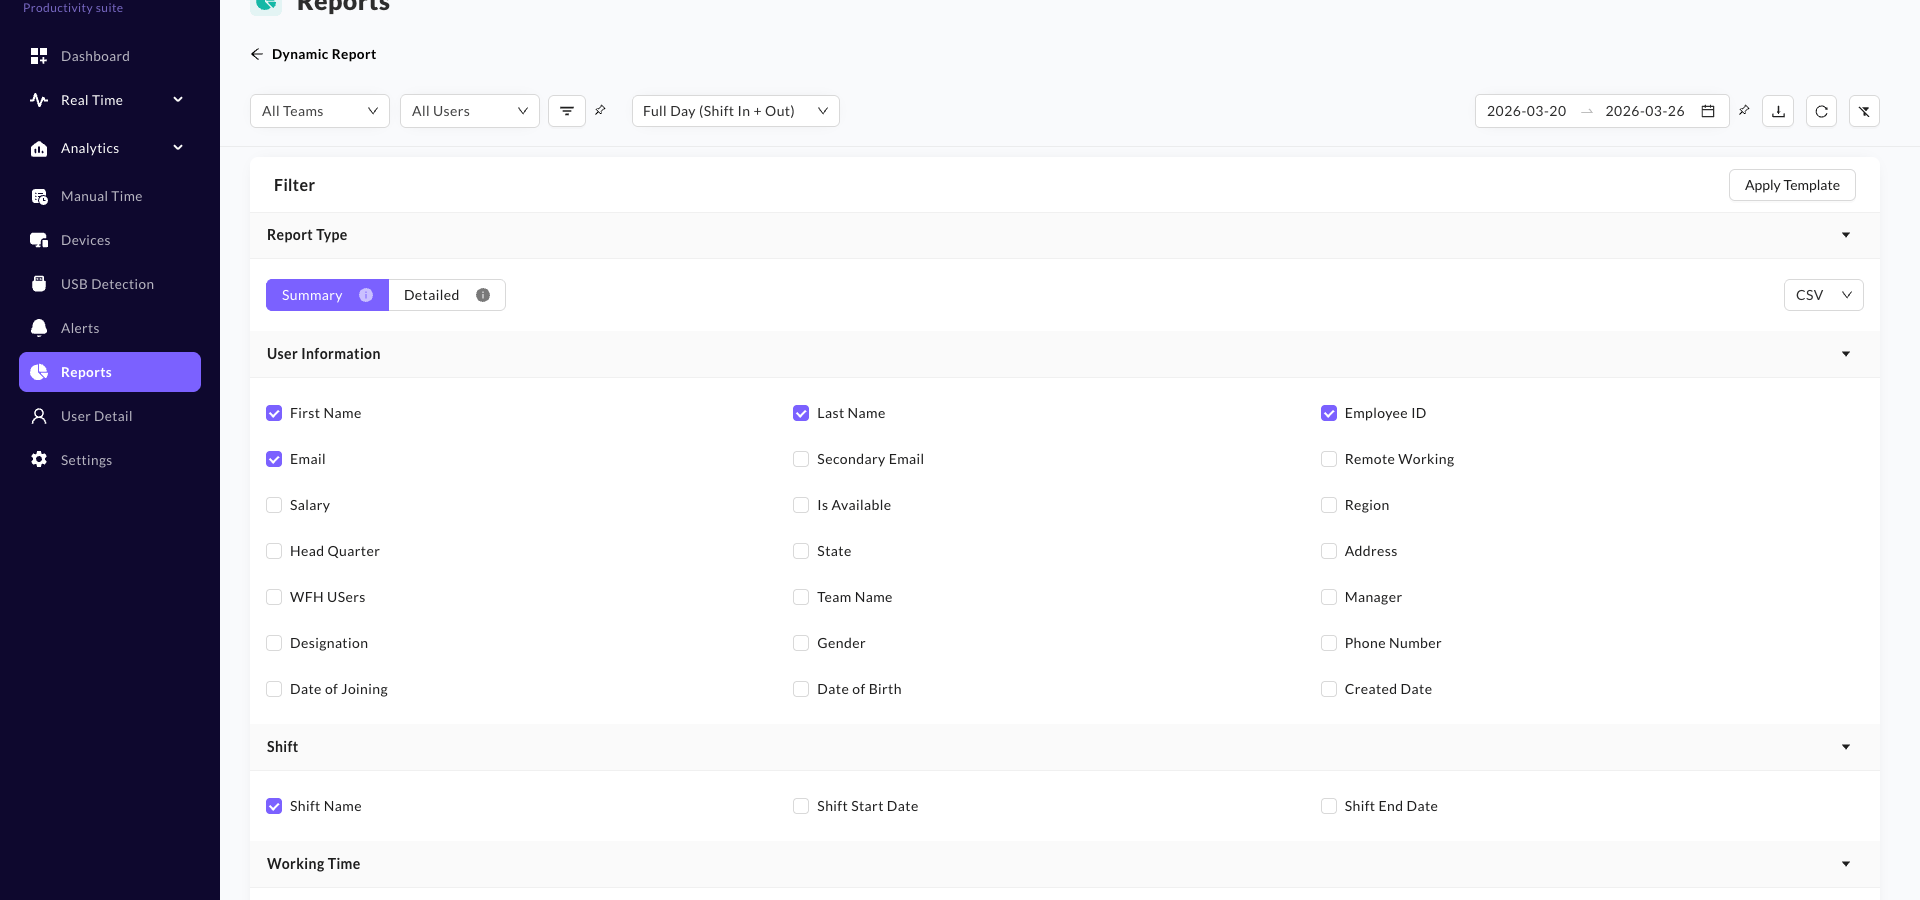
* **Dynamic Reports**: Beyond the standard list of exports, organizations can build fully customized reports by selecting the exact metrics and information to include. The report builder provides **six filter sections**, each containing checkbox items that become columns in the generated report:

  * **Report Type**: Choose between summary or detailed report, and select the download format.
  * **User Information**: Select which user fields to include.
  * **Shift**: Include shift-related data.
  * **Working Time**: Include working time metrics.
  * **Activity**: Include activity-related metrics.
  * **Productivity**: Include productivity-related metrics.

  After configuring the report, clicking the download button prompts you to name the report for easy identification. Dynamic Reports can be downloaded in three formats: **CSV**, **XLS**, or **JSON**.

<figure><img src="/files/3hocByHHJJR0z2ysGo7x" alt="Dynamic Report builder"><figcaption><p>Dynamic Report</p></figcaption></figure>

\* \*\*Scheduled Reports\*\*: Managers can configure We360.ai to automatically generate and email specific reports (e.g., Weekly Attendance) on a recurring basis, eliminating manual data-pulls.


---

# Agent Instructions: Querying This Documentation

If you need additional information that is not directly available in this page, you can query the documentation dynamically by asking a question.

Perform an HTTP GET request on the current page URL with the `ask` query parameter:

```
GET https://docs.we360.ai/reference/work-and-time-management/user-interfaces/portal/universal-tools/reports.md?ask=<question>
```

The question should be specific, self-contained, and written in natural language.
The response will contain a direct answer to the question and relevant excerpts and sources from the documentation.

Use this mechanism when the answer is not explicitly present in the current page, you need clarification or additional context, or you want to retrieve related documentation sections.